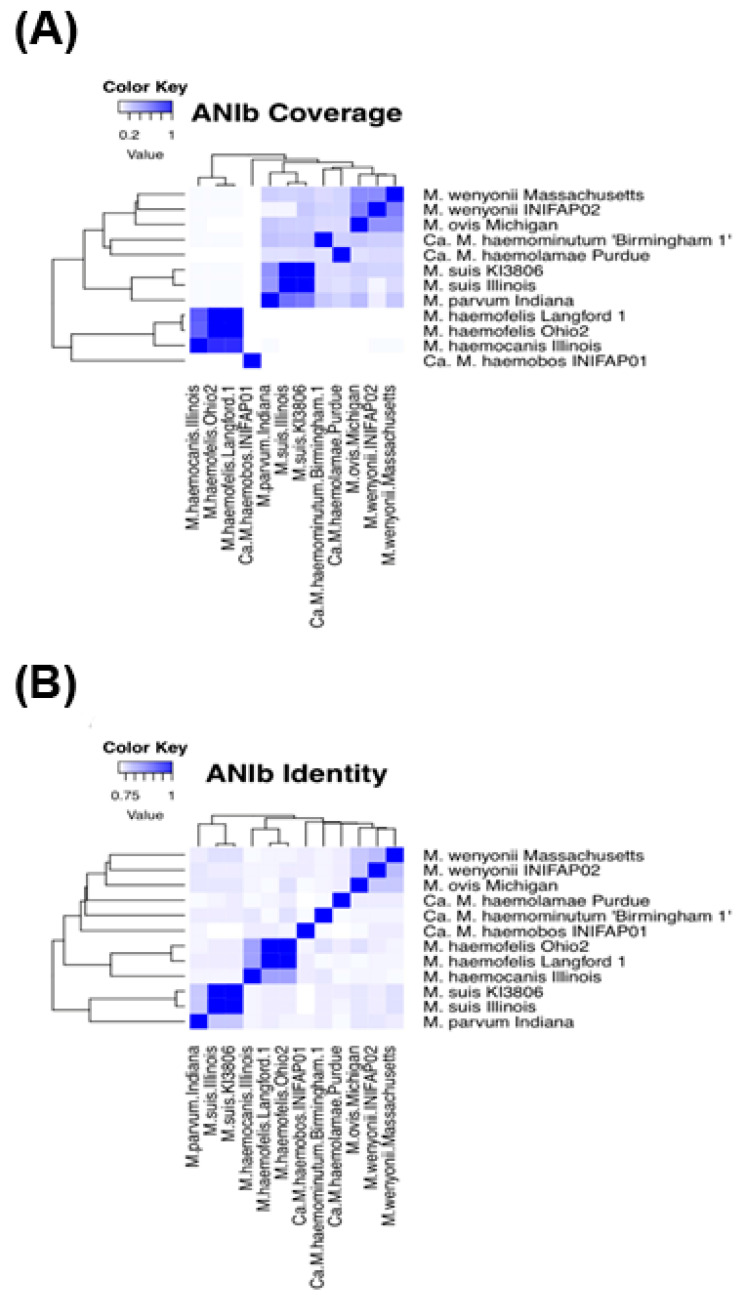
Figure 4.
Heatmaps of blast-based average nucleotide identity (ANIb) values of 12 hemoplasma genomes. (A) Heatmap of ANIb values of alignment coverage. (B) Heatmap of ANIb values of identity. Color intensity increases from white to deep blue when ANIb values approach from 0.0 to 1.0 (0–100%), respectively. The more intense the color, the greater the coverage and identity percentages.

