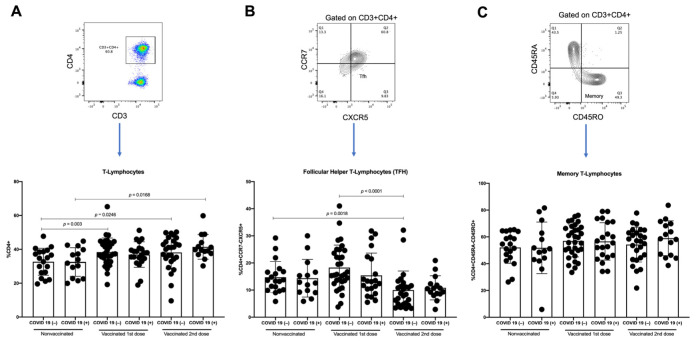
Figure 6.
Analysis of T-lymphocytes. As of samples of nonvaccinated, vaccinated with first vaccine dose, and vaccinated with second vaccine dose from COVID-19(−) and COVID-19(+)participants, we analyzed (A) percentages of T-lymphocytes obtained from CD4 vs. CD3 plot, (B) percentages of follicular helper T-lymphocytes (TFH), obtained from CCR7 vs. CXCR5 plot gated on CD3+CD4+, and (C) percentages of memory T-lymphocytes obtained from CD45RA vs. CD45RO plot gated on CD3+CD4+. Mean ± standard deviation (SD) is shown. Central trend values and dispersion values are indicated in Table S7, Supplementary Data.

