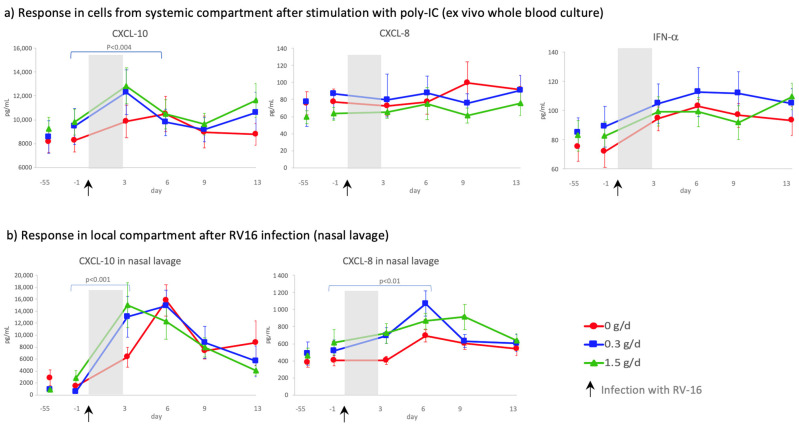
Figure 5.
(a) Concentration of CXCL-10, CXCL-8 and IFN-α in the supernatant of whole blood cultures stimulated with the viral antigen poly-IC (nested subset). Each symbol represents mean ± SEM of minimal 12 subjects per group. (b) Concentration of CXCL-10 and CXCL-8 in nasal lavage at baseline (d-55), just before (d-1) and during rhinovirus infection (d3–13). Symbols represent means ± SEM of ITT population (n = 146). p values indicate the time interval after infection during which the groups are significantly different. Shaded area indicates time between infection and first biological marker sampling point.

