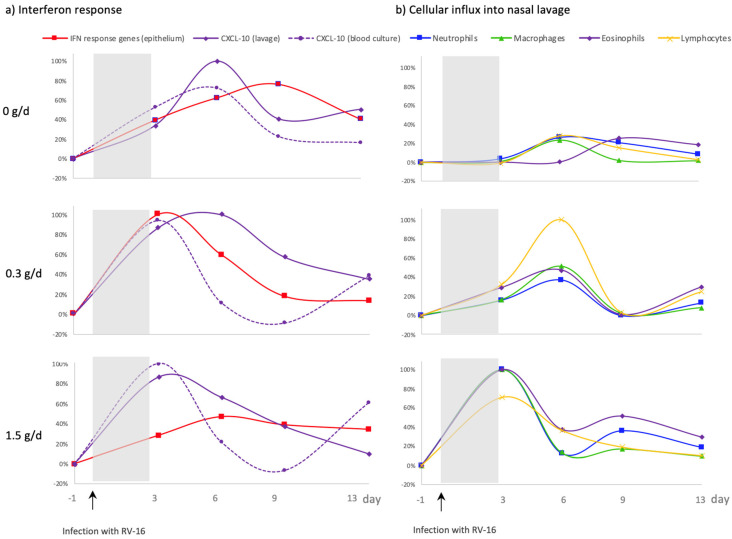
Figure 7.
Kinetics of interferon responses and cellular influx after RV-16 infection (↑) expressed as change vs. d-1 calculated as percent of maximum effect across the three treatment groups. (a) Interferon responses in the local (nasal) compartment (CXCL-10 and IFN response genes), and in the systemic compartment (CXCL-10) after ex vivo stimulation. (b) Recruitment of immune cells into the local (nasal) compartment. Shaded area indicates time between infection and first biological marker sampling point.

