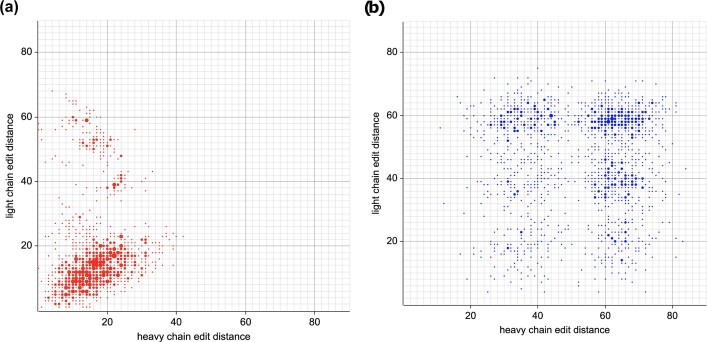
Extended Data Fig. 2. Light chain coherence is visible by sequence similarity.
Each point represents a pair of memory cells from different donors. Heavy and light chain edit distances are plotted, using the amino acids starting at the end of the leader and continuing through the last amino acid in the J segment. Points with identical coordinates are combined by showing a large point whose area is proportional to the number of such points. a, Cell pairs are displayed if the two cells in the pair have the same CDRH3 amino acid sequence. To increase readability, only one third of such pairs were selected at random for display. Of the pairs, 78% have light chain edit distance ≤ 20. This number (78%) is the fraction of cell pairs lying below the horizontal line at light chain edit distance 20, and was computed separately. It is proportional to the fraction of red below the line, if overlap is taken into account. b, [control] The same number of cell pairs were selected at random for display, without regard to CDRH3. Of the pairs, 9% have light chain edit distance ≤ 20.

