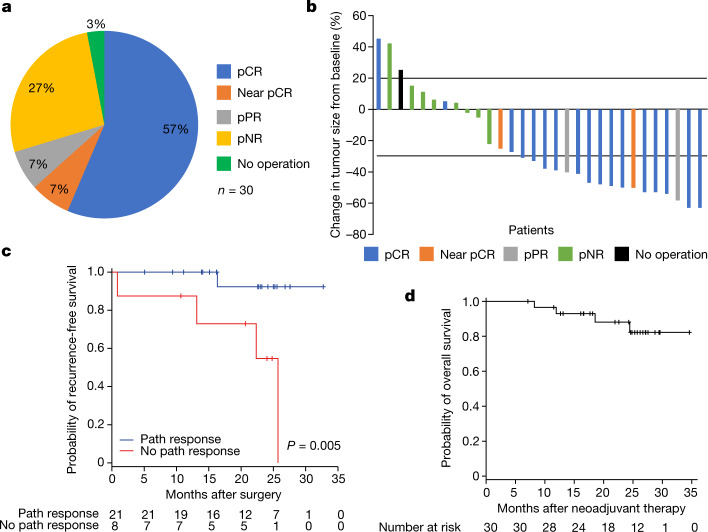
Fig. 3. Response data and long-term outcomes.
a, Breakdown of pathologic responses for the 29 patients who underwent surgery as interpreted by the guidelines of the INMC. Result details (values in chart rounded): no operation, 1 of 30 patients (3.33%);pCR, 17 of 30 patients (56.67%); near pCR, 2 of 30 patients (6.67%);pPR, 2 of 30 patients (6.67%);pNR, 8 of 30 patients (26.67%). b, Waterfall plot of neoadjuvant response as per RECIST 1.1 criteria with colour coding indicating pathologic response. pCR indicates lack of viable tumour. Near pCR indicates greater than 0% but less than or equal to 10% viable tumour, pPR is greater than 10% to less than or equal to 50% viable tumour and pNR is greater than 50% viable tumour. c, Probability of being relapse-free based on any pathologic response versus no pathologic response. d, Overall survival curves for the entire cohort.

