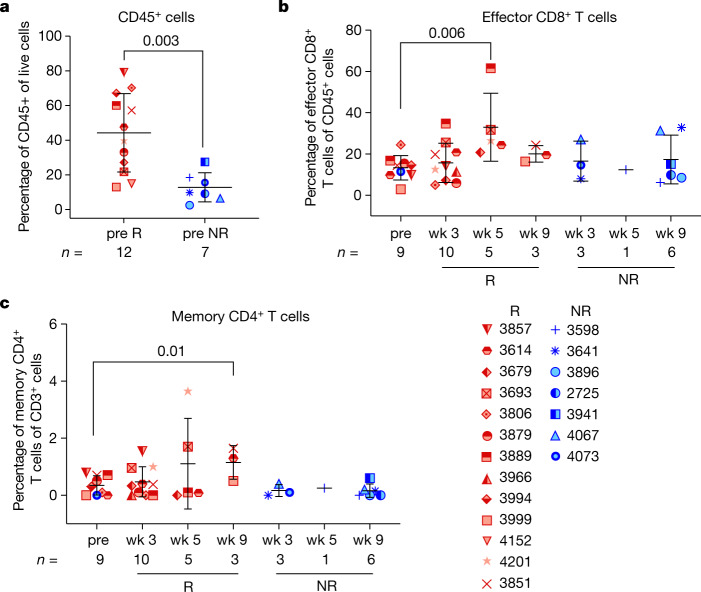
Fig. 4. Correlative analyses in tumour specimens.
Tumour tissue samples harvested from patients at baseline, and post relatlimab and nivolumab treatment were analysed in a single experiment by CyTOF (a–c). a, Frequency of CD45+ cells was assessed through manual gating. b, Frequency of an effector CD8+ T cell subset (CD3+CD8+CD45ROlow) in unsupervised clustering is shown. c, Frequency of a memory CD4+ subset (CD45RO+ICOS+ TCF7+BTLA+CD28+TIGIT+) was determined by unsupervised clustering. Data shown in a–c are mean ± s.d., and n values are indicated in the figure. P values shown in each graph were calculated by two-tailed unpaired t-test, with no multiple comparisons. Red indicates pathologic responders; blue, non-responders. CyTOF, mass cytometry; NR, non-responder; R, responder; wk, week.

