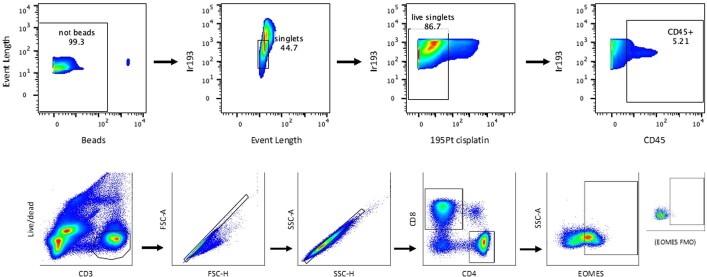
Extended Data Fig. 5. Gating schema for manual analysis of CyTOF data from tumour and blood specimens.
A) Tumours were mechanically dissociated and cells were stained with immune cell-specific antibodies. Specimens were assayed on the Helios mass cytometer via CyTOF Software. Cytometer data were then prepared for manual and unsupervised analyses via FlowJo software. Major cell populations were identified manually and reported. An example of one patient specimen is shown above for reference. B) Gating schema for flow cytometric analysis of blood specimens. Peripheral blood mononuclear cells from patient specimens were stained along with FMO (fluorescence minus one) controls and assayed via a BD LSRFortessa cytometer and BD FACSDiva acquisition software. Data were analysed via FlowJo software as described above. Briefly, live CD3+ singlets were identified and gated into T cell lineages, and those lineages analysed for frequency of each of eight phenotypic markers (BCL6, BLIMP1, CD27, CD28, cMYC, EOMES, ICOS, Ki67) as defined by FMO (fluorescence minus one) specimens. An example of one phenotypic marker (EOMES) in one patient specimen is shown above for reference.

