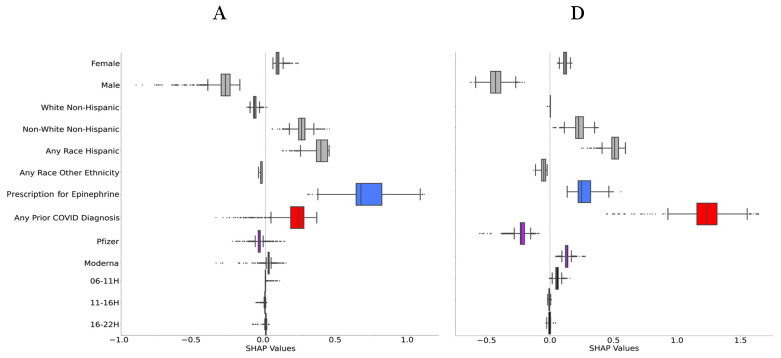
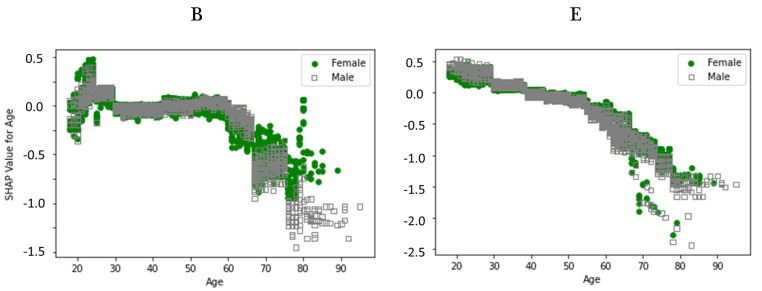
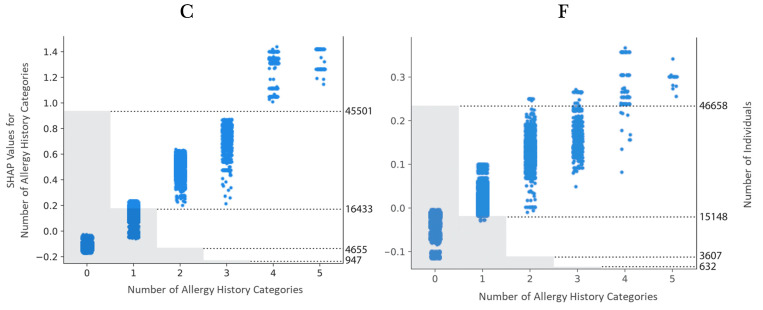
Figure 3.
(A): SHAP value boxplot that shows the direction of impact of each variable on model’s output for allergic side effects. Positive SHAP values are indicative of having side effects, while negative SHAP values are indicative of not having side effects. Box limits indicate 25th and 75th percentile, vertical line within the box indicates 50th percentile, and other vertical lines indicate 5th and 95th percentiles; (B): SHAP feature independent plot for age vs. sex showing the impact of age on model output and (C): SHAP value scatter plot for number of allergy history categories showing the impact of this variable on model output. (D–F): as in (A–C) except for non-allergic side effects. Colors in (A,D): grey—demographics, blue—prescription for epinephrine, red—any prior COVID diagnosis or positive test, purple—vaccine manufacturer, black—time-of-day of vaccination.


