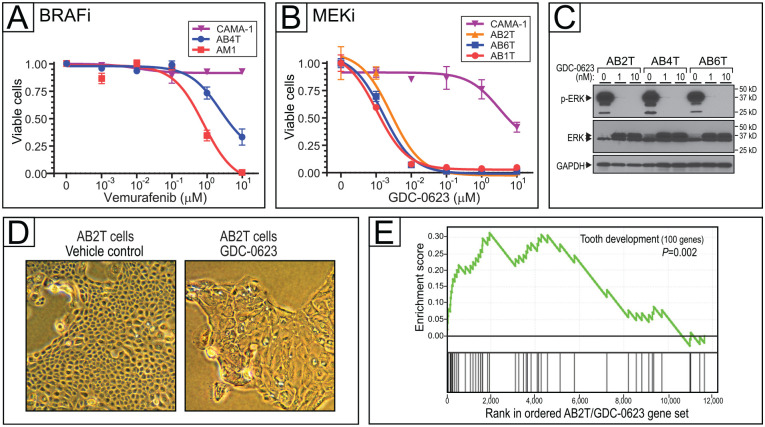
Figure 3.
Targeting mitogen-activated protein kinase (MAPK) pathway mutations in ameloblastoma (AB) cells. (A) BRAF inhibition with vemurafenib in AB cell line with BRAF-V600E mutation (AB4T). Dose–response (inhibition) curves depict cell viability (assayed in triplicate by flow cytometry) over a 4-log range of drug concentration. Error bars represent 1 SD, and IC50 values are reported in Appendix Table 5. (B) MEK inhibition with GDC-0623 in AB cell lines with KRAS-G12R (AB2T), NRAS-Q61R (AB1T), and NRAS-Q61K (AB6T), plus control CAMA-1 cells. Error bars represent 1 SD, and IC50 values are reported in Appendix Table 5. (C) Verification of on-target MEK inhibition (with GDC-0623), by reduced phospho-ERK levels on Western blot. (D) MEK inhibition in AB2T cells (KRAS-G12R) drives morphologic changes; 1 µM GDC-0623 at 72 h versus vehicle control. (E) MEK inhibition by GDC-0623 in AB2T cells (KRAS-G12R) drives transcriptome changes enriched for tooth development genes (gene set enrichment analysis). Core enrichment genes—those in the leading edge of the running enrichment score—are listed in Appendix Table 6.

