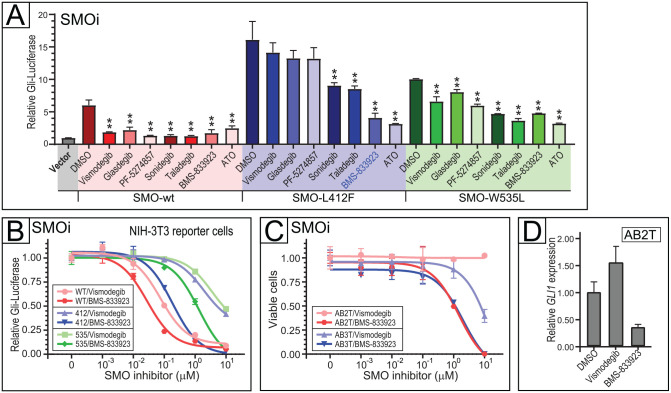
Figure 5.
Targeting SMO mutations in ameloblastoma (AB) cells. (A) Efficacy small-molecule SMO inhibitors (each at 1 µM, except for arsenic trioxide [ATO] at 8 µM) versus SMO wild-type, SMO-L412F, and SMO-W535L. Hedgehog pathway inhibition assayed using a Gli-Luciferase reporter in NIH-3T3 cells with murine Smo replaced by human wild-type or mutant SMO. Assayed in triplicate, mean and 1 SD shown. *P < 0.01, **P < 0.01 (2-sided Student’s t test). (B) SMO inhibition with BMS-833923 in NIH-3T3 Gli-Luciferase reporter cells harboring SMO wild-type, SMO-L412F, and SMO-W535L. Dose–response (inhibition) curves depict Hedgehog pathway activation (assayed in triplicate by dual luciferase) over a 4-log range of drug concentration. Error bars represent 1 SD, and IC50 values are reported in Appendix Table 5. (C) SMO inhibition comparing BMS-833923 versus vismodegib in AB2T (SMO-L412F) and AB3T (SMO-L412F) cells. Dose–response curves depict cell viability assayed in triplicate by flow cytometry. Error bars represent 1 SD, and IC50 values are reported in Appendix Table 5. (D) Verification of on-target Hedgehog pathway inhibition (with 1 µM BMS-83923 versus 1 µM vismodegib or DMSO control) in AB2T cells (by reduced GLI1 transcript levels). RNA was isolated after 48 h of drug treatment. Quantitative reverse transcriptase polymerase chain reaction was done with technical quadruplicates. Error bars indicate RQmax/RQmin.

