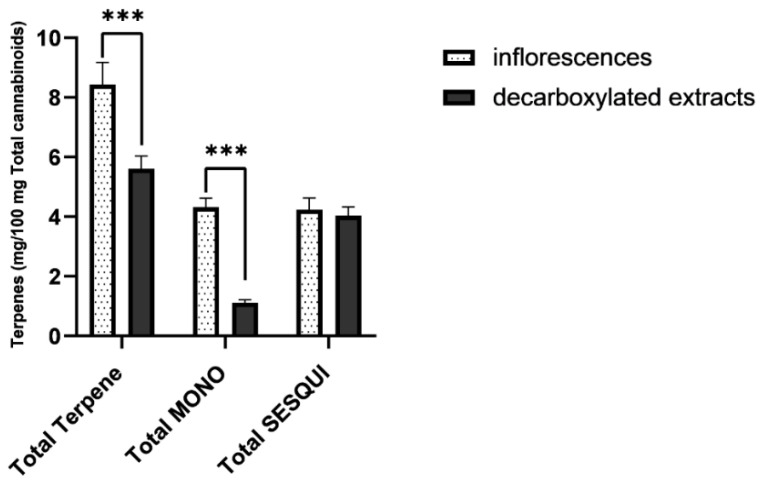
Figure 3.
Averaged terpene/cannabinoid proportions of commercial cannabis inflorescences (n = 19) and commercial cannabis extracts (n = 12), presented as milligrams of each terpene per 100 mg total cannabinoid content. As seen, total terpene proportion in cannabis extracts is significantly reduced. This reduction derives from a significant loss of monoterpene and monoterpenoids. Total MONO = total monoterpenes and monoterpenoids. Total SESQUI = total sesquiterpenes and sesquiterpenoids. Asterisks denote significance level. *** p < 0.001. Error Bars denote SEM.

