
Fig. 4.
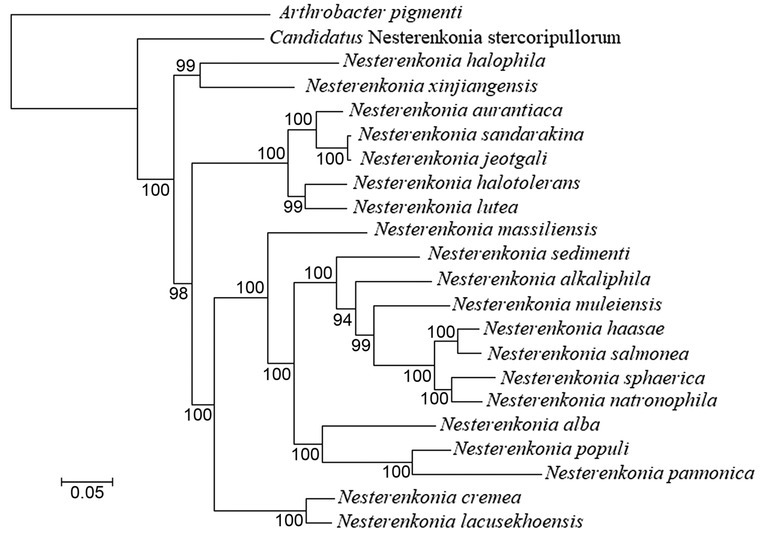
Phylogenomic tree based on 71 bacterial single-copy genes showing the position of Nesterenkonia members. Bootstrap values (expressed as percentages of 1,000 replications) greater than 50% are shown at branch points. Bar, 0.05 represents substitution per nucleotide position. Arthrobacter pigmenti was used as an out-group.