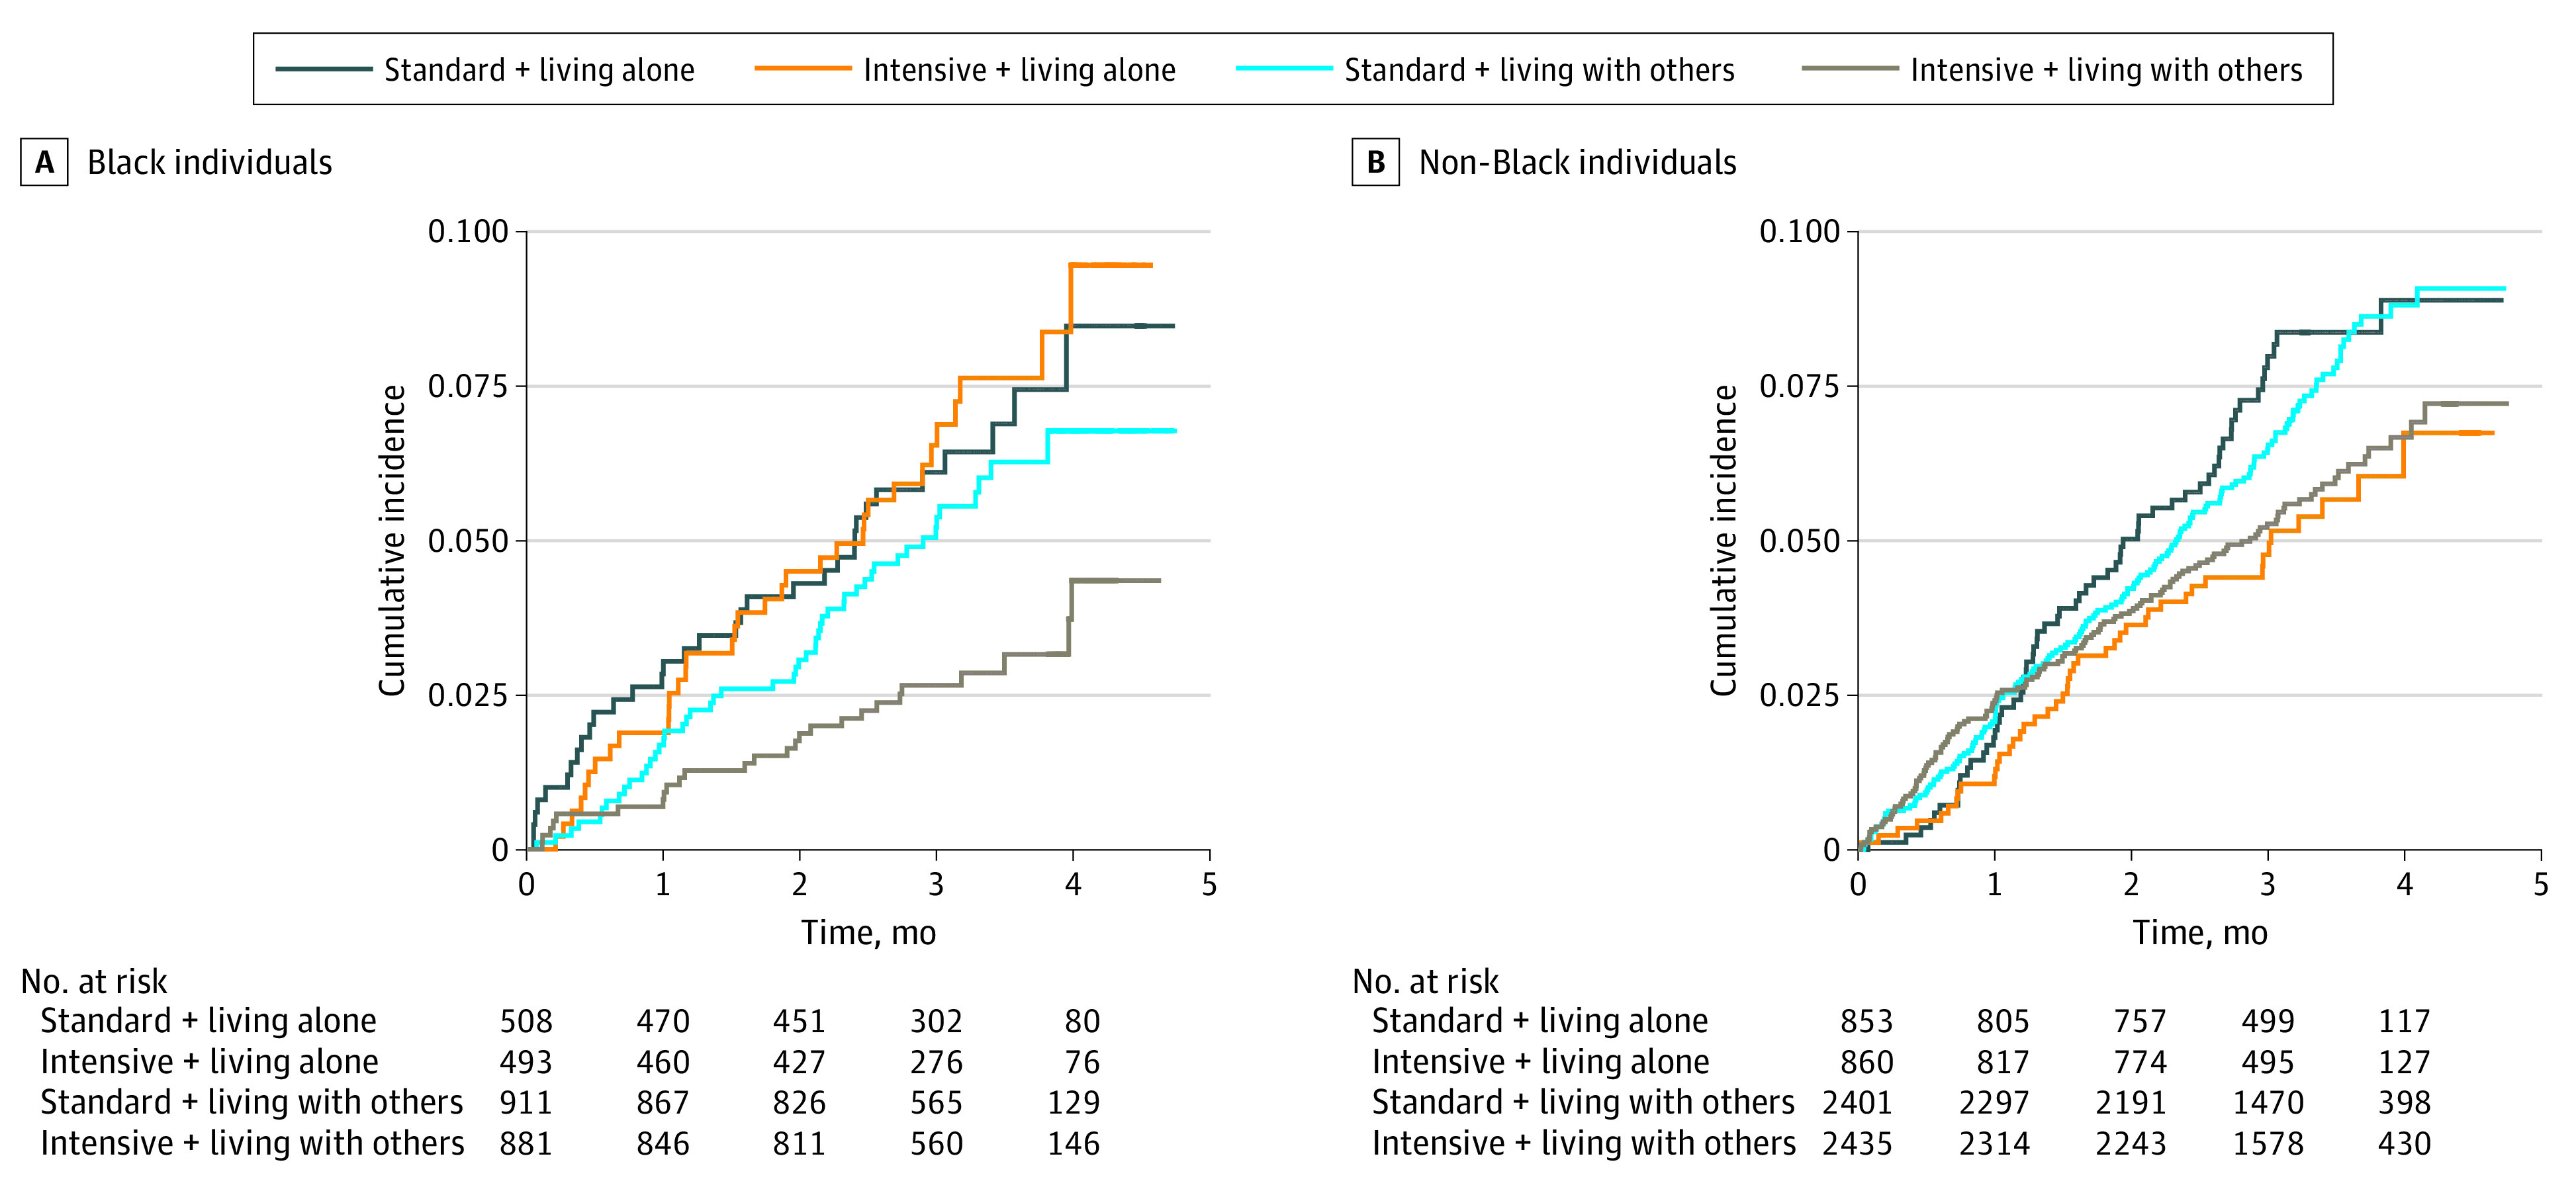
Figure 2. Cumulative Incidence Curves for Cardiovascular Outcomes According to Living Arrangement Status (Living Alone vs Living With Others) and Treatment Assignment (Intensive vs Standard Blood Pressure Control) Among Black Individuals and Non-Black Individuals.

Non-Black individuals indicate those who identified as Alaskan Native, American Indian, Asian, Native Hawaiian, Pacific Islander, White, or other during the Systolic Blood Pressure Intervention Trial.
