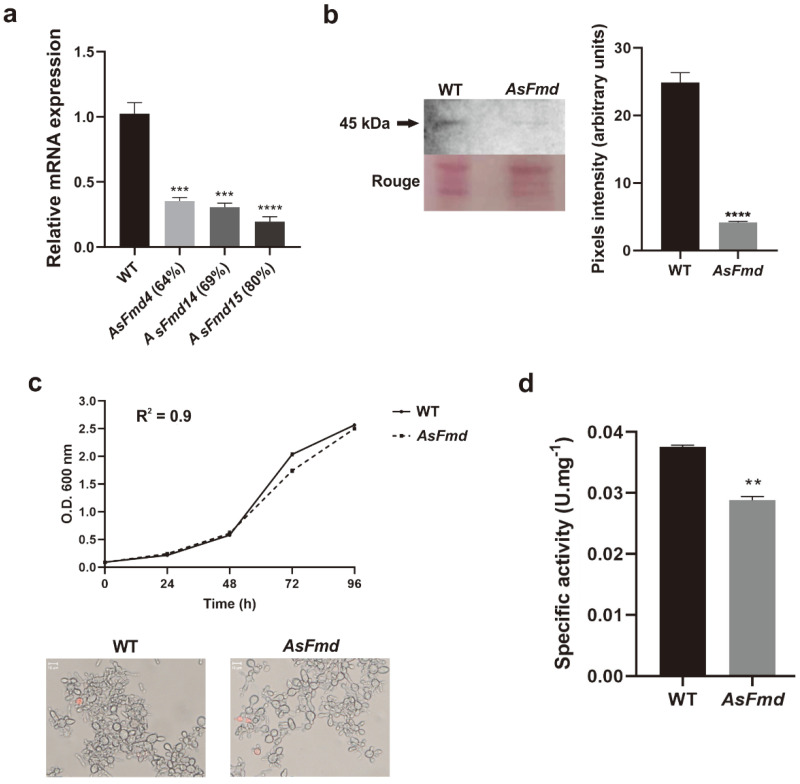
Figure 2.
P. lutzii fmd gene silencing. (a): Relative quantification of fmd expression in WT and AsFmd strains through RT-qPCR. The tubulin gene (PAAG_03031) was used as endogenous control. (b): Fmd expression analysis in WT and AsFmd strains through immunoblotting. Rouge: WT and AsFmd protein extract stained with Rouge-Ponceau exhibiting similar protein quantification. Polyclonal antibody anti-PbFmd was incubated with 30 μg of protein extracts. Pixel intensity was measured by densitometric analysis of immunoblotting bands using ImageJ software. Pixel intensity from three replicates was measured by densitometric analysis of immunoblotting bands using ImageJ software. (c): Growth and viability of WT and AsFmd strains. WT and AsFmd strains were grown in BHI for 96 h. O.D. was measured daily at 600 nm to determine growth curve. Microscopy represents P. lutzii cell viability that was accessed by staining with propidium iodide (1 μg/mL) on the last day of the growth curve. Dead cells are colored in red. Images were obtained using an Axioscope A1 microscope (Carl Zeiss) at 493/623 nm and magnified 1000×. (d): Formamidase enzymatic activity in 500 ng of WT and AsFmd protein extract. Error bars represent standard deviation of three experimental replicates. Shapiro–Wilk test was employed to determine data normality: RT-qPCR (p values > 0.2), densitometric analysis of immunoblotting bands (p values > 0.2) and formamidase activity (p values > 0.8). Student’s t-test was applied for statistical analysis of relative quantification of fmd expression through RT-qPCR and densitometric analysis of immunoblotting bands. **** represents p values < 0.000, *** represents p values ≤ 0.0005 and ** represents p values ≤ 0.005.

