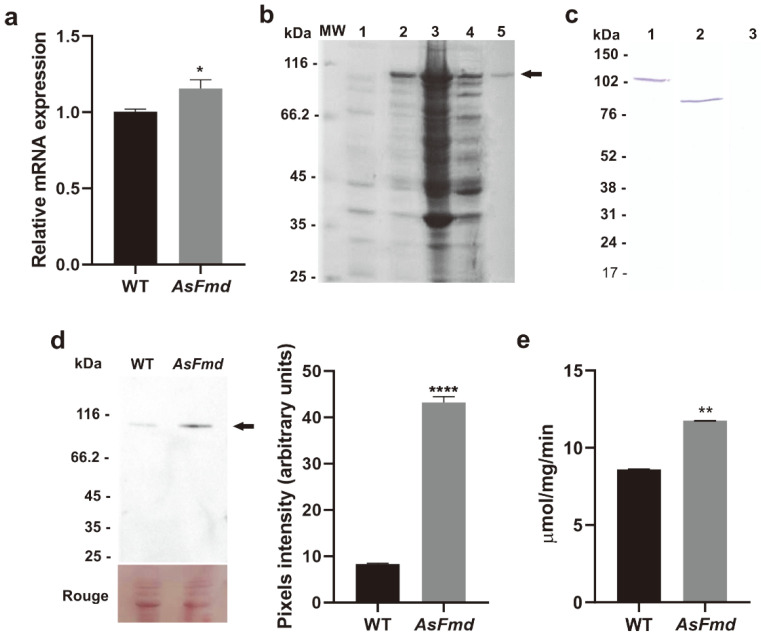
Figure 3.
Urease expression, immunoblotting, and enzymatic activity analysis. (a): Relative quantification of urease expression in WT and AsFmd strains through RT-qPCR. The tubulin gene (PAAG_03031) was used as endogenous control. Statistical analyses were performed through Student’s t-test. * represents p values < 0.05. (b): Heterologous expression and purification of recombinant urease analysis through SDS-PAGE. MW: protein molecular weight marker. 1: E. coli protein extract prior to IPTG induction. 2: Urease expression (arrow, 103 kDa) after 3 h of induction with 1.0 mM IPTG. 3: Pellet after cell lysis. 4: A 103 kDa protein, equivalent to urease size, on soluble supernatant after cell lysis. 5: Purified recombinant urease after affinity chromatography with NI-NTA AGAROSE resin. (c): Immunoblotting for anti-Ure antibody specificity test. 1: Incubation of anti-Ure (1:5000) with 10 μg of purified rUre, rendering a 103 kDa protein, equivalent to 83 kDa of PbUre fused to 20 kDa of His-tag. 2: Incubation of anti-Ure (1:5000) with 30 μg of P. lutzii total protein extracts. 3: Incubation of pre-immune serum (1:500) with 30 μg of P. lutzii total protein extracts. (d): Analysis of urease expression in WT and AsFmd strains through immunoblotting. The arrow indicates urease protein (85 kDa). Rouge: WT and AsFmd protein extract stained with Rouge-Ponceau exhibiting similar protein quantification. Pixel intensity was measured by densitometric analysis of immunoblotting bands from experimental triplicates using ImageJ software. (e): Urease enzymatic activity in 500 ng of WT and AsFmd protein extract. Shapiro–Wilk test was employed to determine data normality: RT-qPCR (p values > 0.4), densitometric analysis of immunoblotting bands (p values > 0.5) and urease activity (p values > 0.6). Student’s t-test was applied for statistical analysis of RT-qPCR, densitometric analysis of immunoblotting bands and urease activity. **** represents p values < 0.0001 and ** represents p values ≤ 0.005. Error bars represent standard deviation of three experimental replicates.

