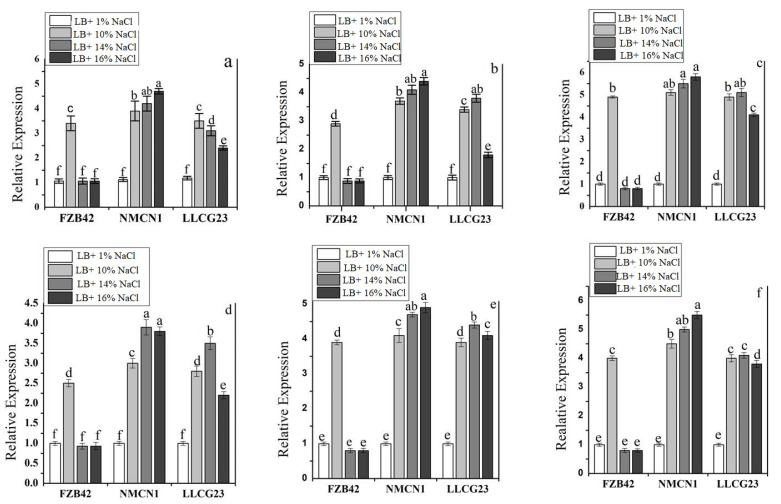
Figure 2.
Expression analysis of predicted genes in Bacillus strains FZB42, NMCN1 and LLCG23 grown in different NaCl concentrations (1%, 10%, 14% and 16%). The genes analysed were: DegU (a), OstB (b), OhrR (c), ComA (d), SodA (e) and OpuAC (f). The error bars on the columns indicate the standard deviation of the mean (n = 3). Letters above the columns represent significant differences between treatments at p ≤ 0.05. The expression studies were repeated thrice with three replicates for each treatment.

