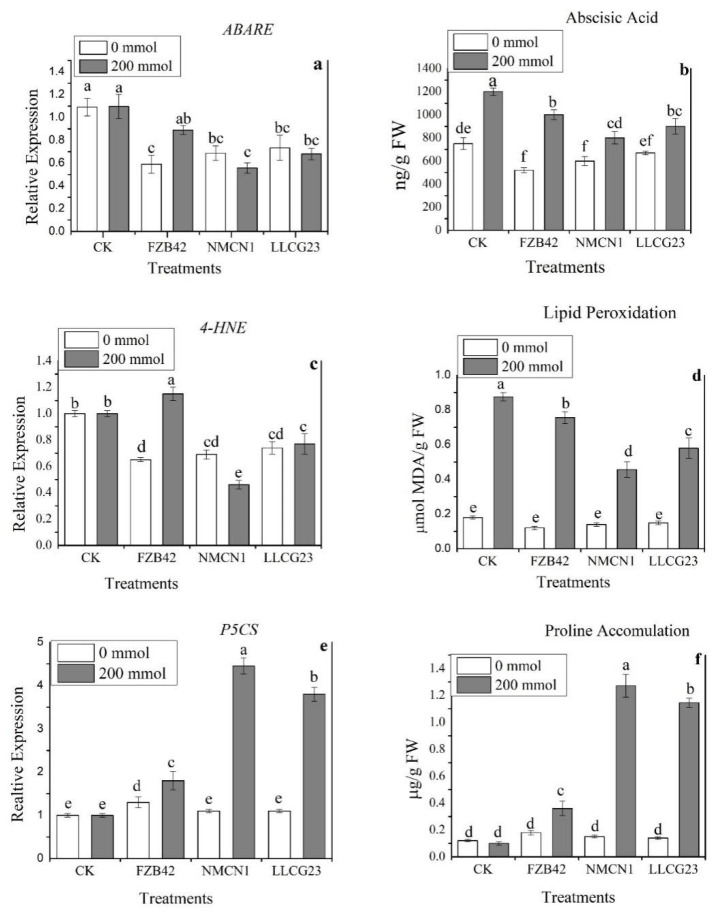
Figure 6.
Relative expression and quantification of Abscisic acid, Proline and Lipid peroxidisation. (a) Expression profiling of abscisic acid (ABA) encoding gene ABARE, (b) ABA quantification through UPLC analysis in wheat plants under salt stress (200 mmol NaCl), (c) expression analysis of MDA encoding gene (4-HNE), (d) quantification of MDA content through spectrophotometric method in wheat plants grown under saline condition, (e) expression analysis of proline encoding gene P5CS, (f) spectrophotometric quantification of proline. The error bars on the columns represent the standard deviation of the mean (n = 3). The small letters were used to show significant difference among the treatments calculated through Tukey’s HSD test at p ≤ 0.05. The experiment was repeated thrice with three replicates for each treatment.

