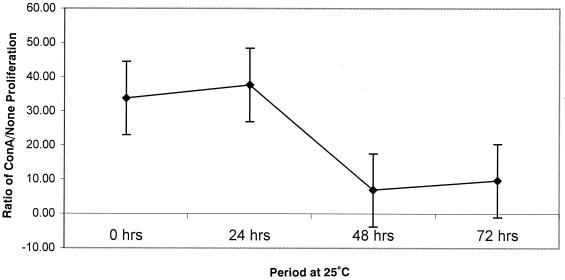
FIG. 2.
Plot of T-cell proliferation after ConA stimulation in blood samples obtained from human volunteers. Three blood samples from healthy volunteers were collected (no vaccination) and stored at 25°C. These samples were processed at day 0, day 1, day 2, and day 3, and the cell concentrations were adjusted to 106 cells/ml. The cells were harvested and count to determine H3 incorporation. The results are expressed as the ratio of sample counts with ConA to the corresponding control counts obtained without ConA.

