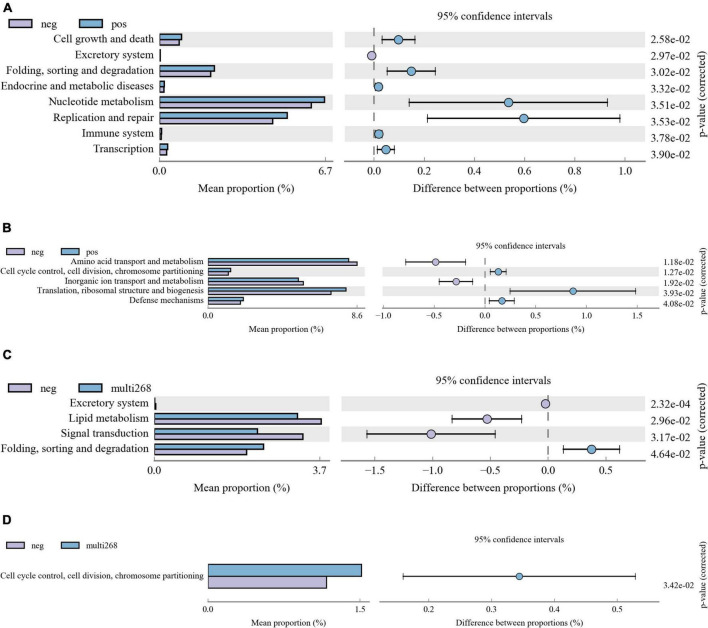
FIGURE 3.
Microbiota KEGG and COG function difference diagrams. The picture shows the difference analysis diagram of the KEGG (and COG) metabolic pathway under the second level (also can be analysed for the third or first level): the different colours in the picture represent different groups. The figure shows the abundance ratio of different functions in the two sets of sample groups, the middle shows the difference ratio of the function abundance within the 95% confidence interval, and the rightmost value is the p-value. (A) KEGG pathway difference between HPV-positive and HPV-negative patient groups, (B) COG pathway difference between HPV-positive and HPV-negative patient groups. (C) KEGG pathway difference between multi-268 HPV infections and HPV-negative patient groups, (D) COG pathway difference between multi-268 HPV infections and HPV-negative patient groups. KEGG, Kyoto Encyclopedia of Genes and Genomes; COG, Clusters of Orthologous Groups.

