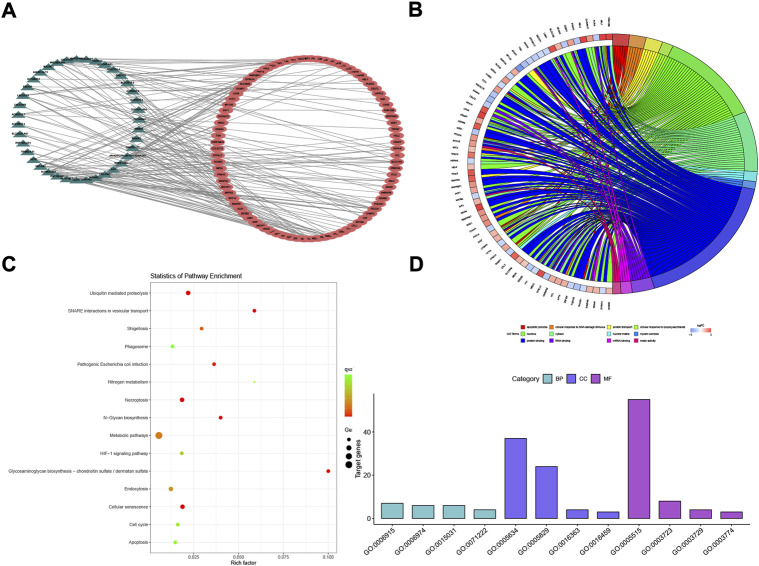
FIGURE 3.
POI-based lncRNA–mRNA network (POILMN) and functional enrichment analysis of mRNAs. The dark green triangles represent lncRNA, and the red cycles represent mRNAs. There were 39 lncRNA nodes, 86 mRNA nodes, and 177 edges in the network (A). Distribution of integrated DEGs in premature ovarian insufficiency for different GO-enriched functions (B). KEGG pathway enrichment analysis of the integrated DEGs (C). The GO enrichment bar chart of DEGs presents the number of DEGs enriched in biological processes, cellular components, and molecular functions (D).

