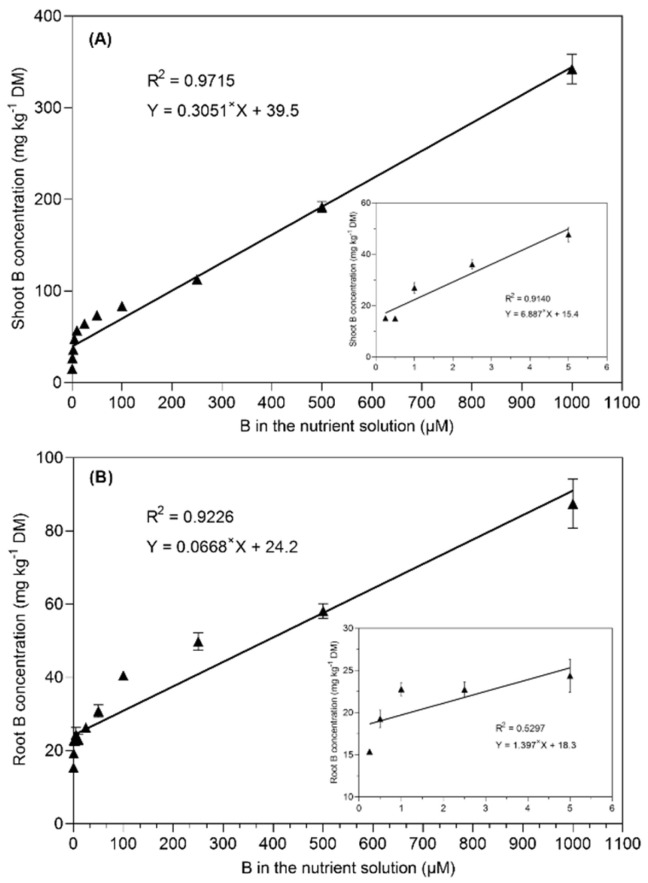
Figure 4.
Linear regression between the B concentration in the nutrient solution and the shoot B concentration (A) and root B concentration (B) in B. napus grown with different B concentrations in a nutrient solution for 28 days. The data points represent the means (±SE) of four independent replicates.

