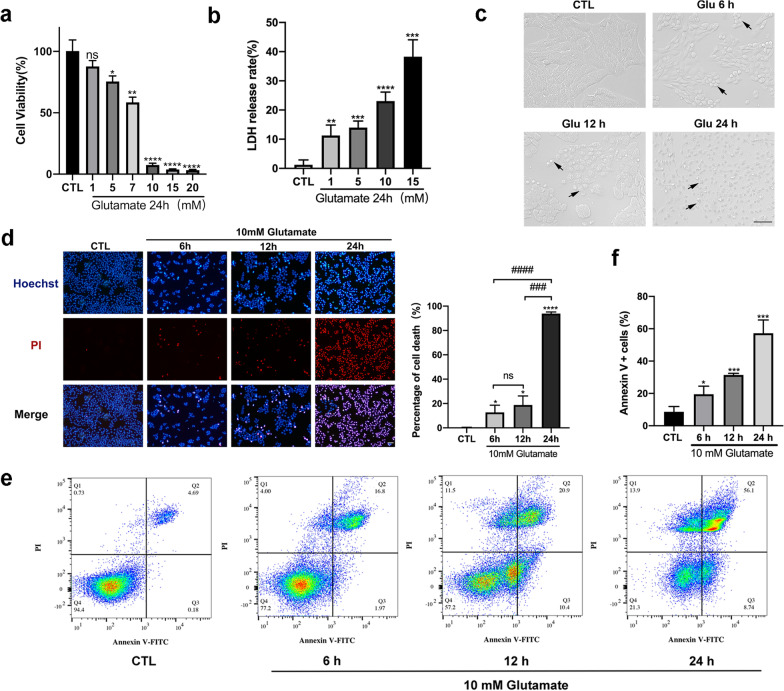
Fig. 1.
Necroptosis induced by glutamate in R28 cells. a CCK-8 assay for R28 cells treated with different concentrations of glutamate for 24 h. b LDH release assay was used to test the cell death rate of R28 cells treated with different concentrations of glutamate for 24 h. c Morphology of R28 cells exposed to 10 mM glutamate for 6 h, 12 h, and 24 h. The cells were photographed under a light microscope. The black arrows indicate the morphological changes of R28 cells induced by glutamate. Scale bar = 50 μm. d Hoechst–PI dual staining assay was used to test the cell death rate of R28 cells after administration of 10 mM glutamate for 6 h, 12 h, and 24 h. Cell death rate increased in a time-dependent manner. Scale bar = 50 μm. e, f Flow cytometry with Annexin V/PI double staining was used to detect the percentage of apoptosis and necrosis in R28 cells after glutamate treatment. CTL: the control group. The results were recorded as mean ± SD from at least three independent experiments. *p < 0.05, **p < 0.01, ***p < 0.001, ****p < 0.0001 versus control group; ###p < 0.001, ####p < 0.0001. ns: not significant

