Fig. 2.
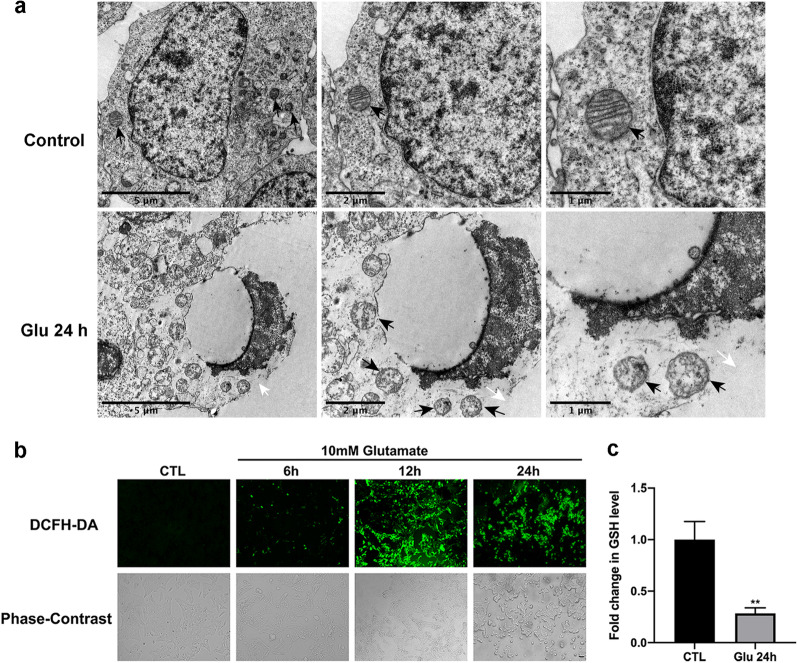
Necroptotic morphology and overproduction of ROS in R28 cells induced by glutamate. a The typical morphological changes of necroptosis were detected in glutamate-treated R28 cells by transmission electron microscopy (TEM), including cell swelling, vesiculation of cytoplasmic organelles and rupture of the plasma membrane. Black arrows indicate mitochondria; white arrows indicate rupture of plasma membrane. b Representative phase-contrast and fluorescence microscope images of R28 cells incubated with the ROS probe DCFH-DA after exposure to glutamate for different durations. The green fluorescence intensity indicated the level of intracellular ROS. Scale bar = 50 μm. c Cellular GSH levels were measured at 24 h after glutamate treatment. CTL: the control group; Glu: glutamate. The results were recorded as mean ± SD from at least three independent experiments. **p < 0.01 versus control group

