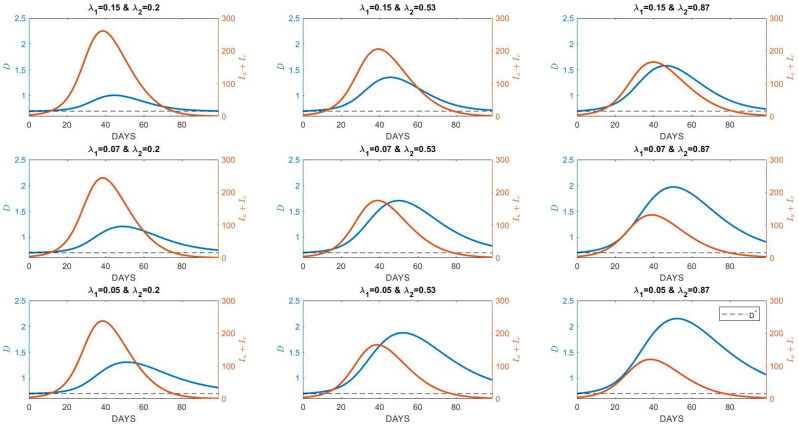
Figure 4.
Numerical simulations for different values of the rate of resistance and response to disease prevalence . Blue lines represent the average interaction distance, while the orange lines represent the burden of cases. The values of and are provided for three different values (low, moderate, high); and . All figures were generated by choosing and m and other parameters that evaluate the values of to exceed 1; .

