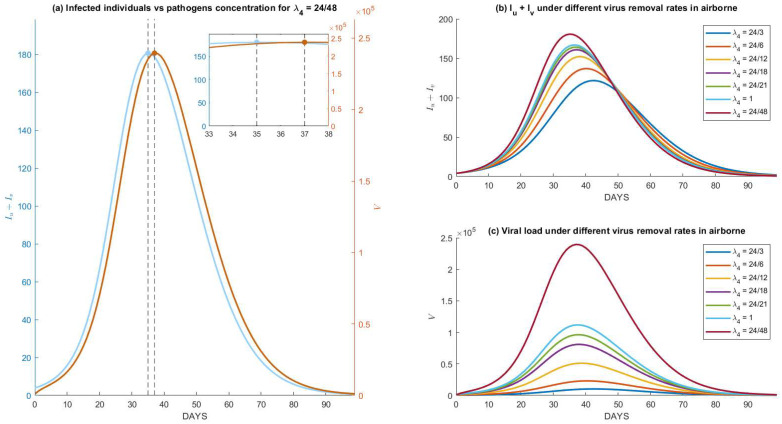
Figure 5.
Numerical simulations of System (1) and (2) under different removal rates of airborne pathogens, that is implicated in the critical period of pathogens to remain active airborne: (a) comparison between the dynamics for infected individuals and viral load for a critical period of 48 h, which shows an exact lag of 48 h between the peak of infections and its viral loads, (b,c) dynamics for and its viral load under different critical periods of the airborne pathogen.

