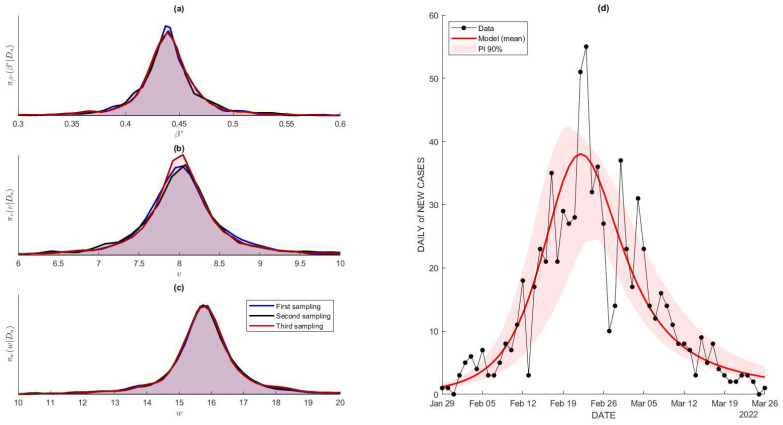
Figure 6.
(a–c) Posterior distribution for , and , estimated using MCMC method with prior of normal distributions: , with being the estimated single point and being a higher value to acquire the possibility of achieving the global minima. We generated three independent samples to portray the posterior density to ensure its consistency. (d) The comparison between the data (daily new cases) and the model with its 90% prediction interval.

