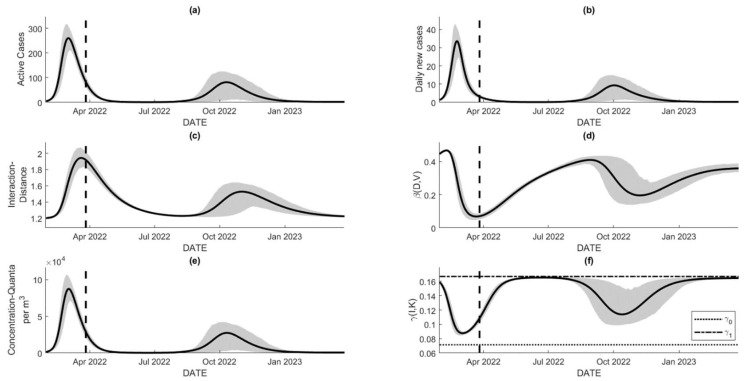
Figure 7.
The extrapolated figures with the dashed line initiate the prediction window. The figures were evaluated using the estimated parameters obtained in the previous section, with the assumption of no significant change in parameters for the 365-day prediction intervals: (a,b) extrapolated number of active cases and daily new cases that levels off in around May to July 2022, but starts to increase on August and peaks on October 2022, (c) average interaction distance of society that will approach its natural distancing of m as the number of cases decreases, but increases when the case resurgence is identified, (d) time-dependent transmission rate that gradually increasing as approaches , (e) dynamic for viral load over time that resembles that for active cases, and (f) time-dependent recovery rate that its values are bounded by γ0 and .

