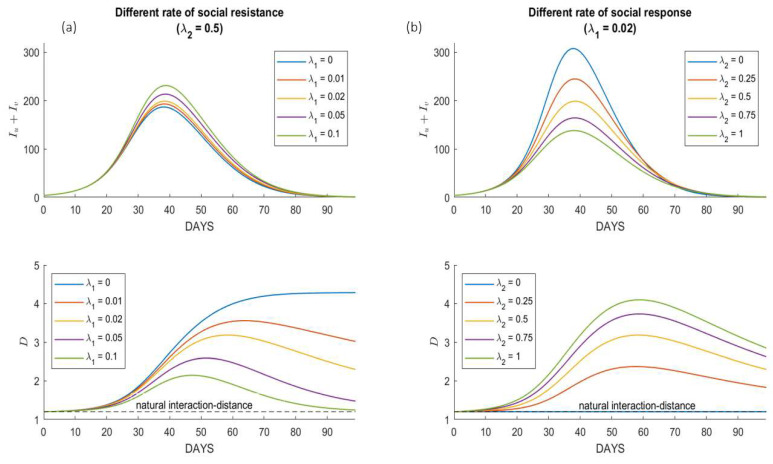
Figure A1.
Number of infected individuals in society of population 1000 individuals under different values of socio-resistance and social response rates. (a) five different values of socio-resistance by setting . Each scenario has , for ascending order of . (b) Five different values of social response by setting .

