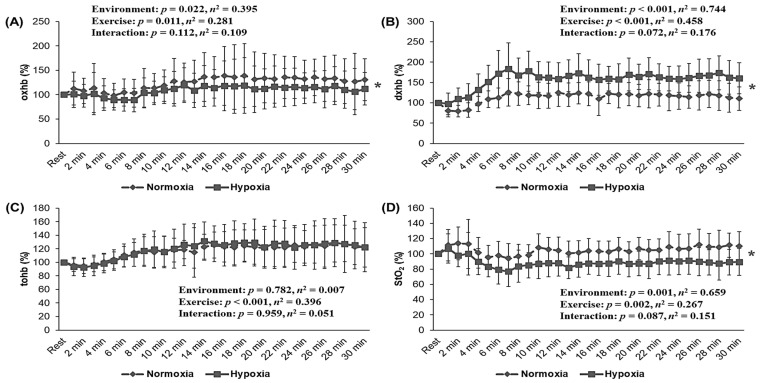
Figure 5.
Changes in skeletal muscle oxygenation during 30 min of endurance exercise at the same relative exercise intensity (70%HRmax) under normoxia (760 mmHg) and hypoxia (526 mmHg, simulated 3000 m). (A) oxhb, (B) dxhb, (C) tohb, (D) StO2. HRmax: maximal heart rate; oxhb: oxygenated hemoglobin; dxhb: deoxygenated hemoglobin; tohb: total hemoglobin; StO2: tissue oxygenated saturation. The bars indicate the mean ± S.D. *: Significant difference within the environmental condition (normoxia vs. hypoxia) during 30 min of the endurance exercise.

