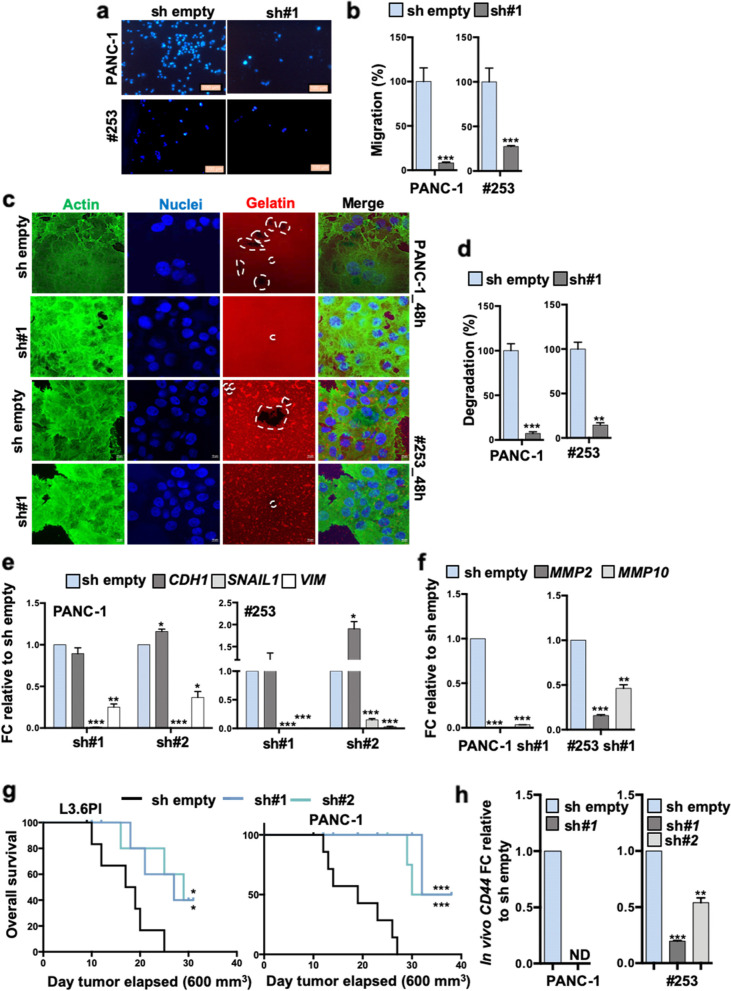
Fig. 3.
Loss of LAMC2 reduces tumorigenicity. a Migration assay for sh empty versus LAMC2 knockdown cells. The nuclei were stained with DAPI (blue). b Migratory potential of sh empty versus LAMC2 knockdown cells. c Representative images of gelatin degradation for sh empty versus LAMC2 knockdown cells. Nuclei were stained with Hoechst 33342 (blue), green represents actin (Alexa Fluor™ 488 Phalloidin) and red illustrates gelatin (Rodhamine). The white dashed lines circles indicates the areas of degradation. d Invasive potential of sh empty versus LAMC2 knockdown cells. e qPCR analysis for EMT genes in sh empty and LAMC2 knockdown cells. Data are normalized to GAPDH and are presented as fold change in gene expression relative to sh empty. f qPCR analysis for MMP2 and MMP10 gene expression in sh empty and LAMC2 knockdown cells. Data are normalized to GAPDH and are presented as fold change in gene expression relative to sh empty. g Kaplan–Meier curve for sh empty and LAMC2 knockdown cells subcutaneously xenografted into nude athymic mice. n ≥ 10. h qPCR analysis for CD44 gene expression in sh empty and LAMC2 knockdown cells isolated from respective tumors. Data are normalized to GAPDH and are presented as fold change in gene expression relative to sh empty. *p < 0.05, **p < 0.005, ***p < 0.0005. n Statistical significance was assessed by Student's t-test. For the Kaplan–Meier curve, the statistical significance was assessed by the log-rank (Mantel-Cox) test

