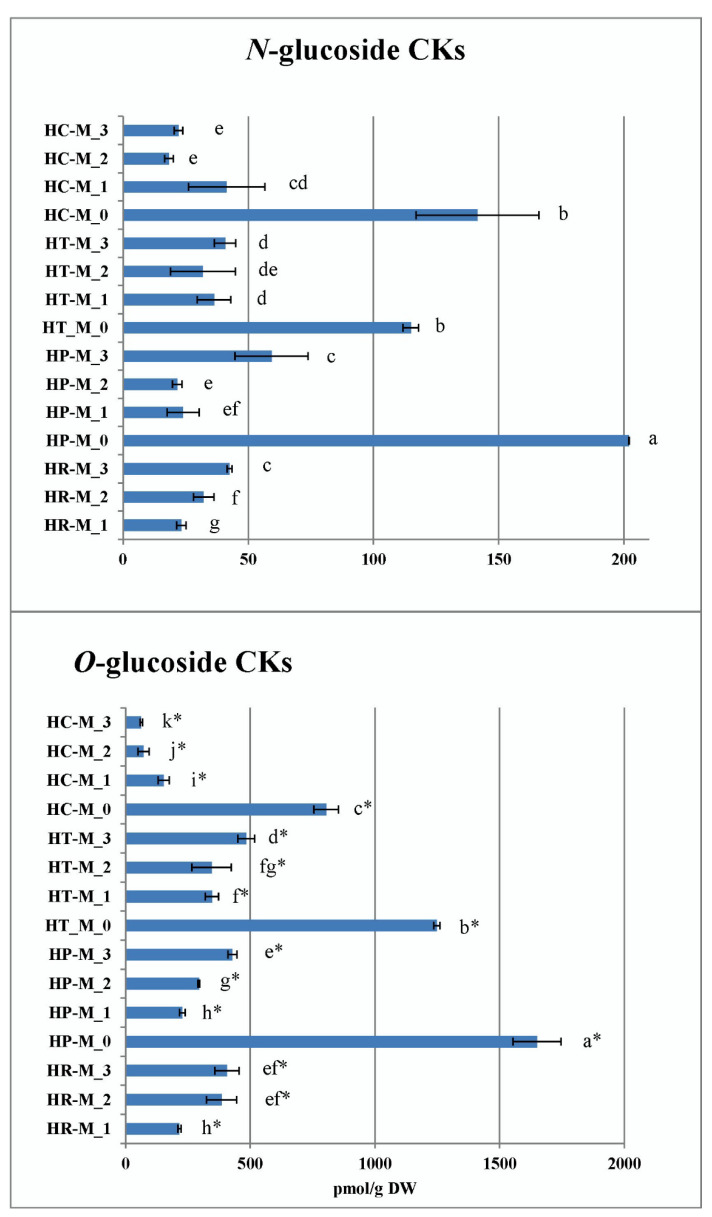
Figure 10.
Total sum of cytokinin N- and O-glucosides (upper and lower figure, respectively) in the four Hypericum species in M_0—PGR-free, M_1—0.2 mg/L BA, M_2—0.2 mg/L BA + 0.1 mg/L IBA and M_3—0.1 mg/L BA + 0.2 mg/L IBA supplemented media, HR–H. richeri Vill., HP–H. perforatum L., HT–H. tetrapterum Fries. and HC–H. calycinum. Same letters indicate statistically non-significant and different letters indicate statistically significant differences in mean values when comparing samples separately for each of the two parameters (comparisons of O-glucoside CKs—distinguished by an asterisk from N-glucosides comparisons).

