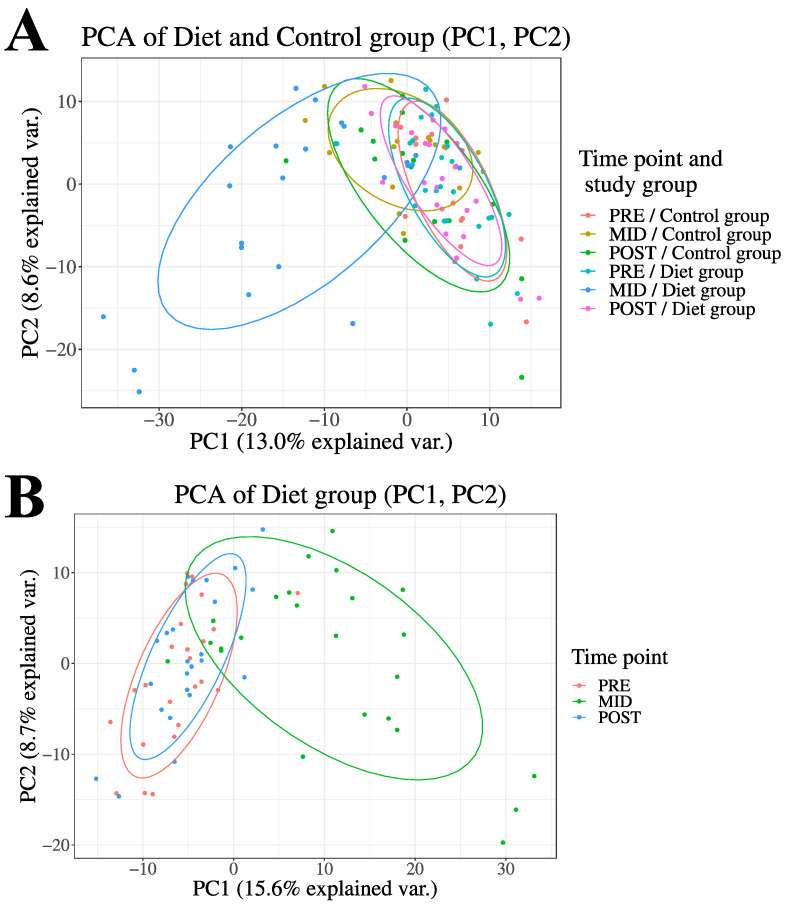
Figure 2.
Principal Component Analysis (PCA) of the LC-MS metabolome. Here, we demonstrate overall changes in how the prolonged period of low-energy availability and high volume of exercise training led to substantial fat mass loss (PRE-MID) and subsequent weight regain period (MID-POST) modulated plasma LC-MS metabolome profile (684 metabolite features) in the diet group when compared to controls Panel (A). Control group variation during the entire study period (PRE-MID-POST) depicted in two-dimensional PCA plot Panel (A). The group and time point annotation is as follows: (1) red = diet group (PRE), (2) green = diet group (MID), (3) blue = diet group (POST), (4) yellow = control group (PRE), (5) turquoise = control group (MID), (6) pink = control group (POST). In panel (B), only the diet group-associated changes are demonstrated for clarity of interpretation.

