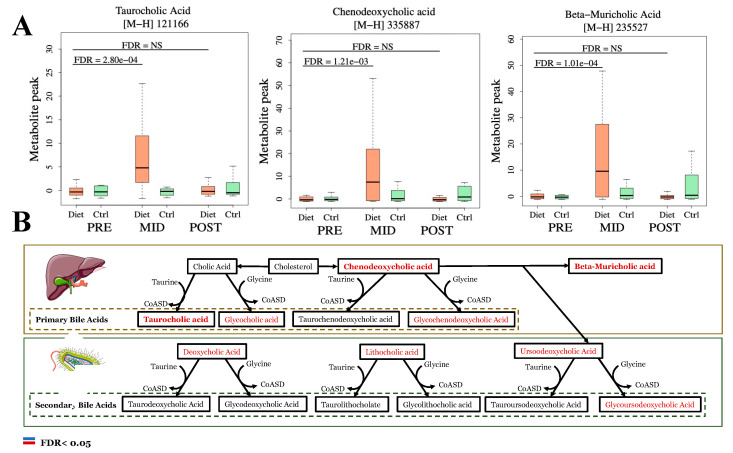
Figure 3.
Substantial fat mass loss promotes accumulation of plasma primary bile acid (BA) metabolism intermediates. Bile acid (BA) metabolism pathways related to the generation of primary and secondary BAs are depicted in this figure. In primary and secondary BA metabolism pathways, withing-diet group (~Time) upregulated (FDR < 0.05) metabolites following the weight loss period (PRE-MID) are indicated with red color and bolded where interaction (~Time × Group) was also significant (Panel B), and those are also depicted with boxplots (Panel A). Metabolites with no clear change in the metabolite level with color black (PRE-MID) (Panel B). No decreases were observed in metabolites participating in bile acid metabolism. For boxplot computation, duplicate features of same metabolites were excluded, and features with highest absolute value were selected for plotting.

