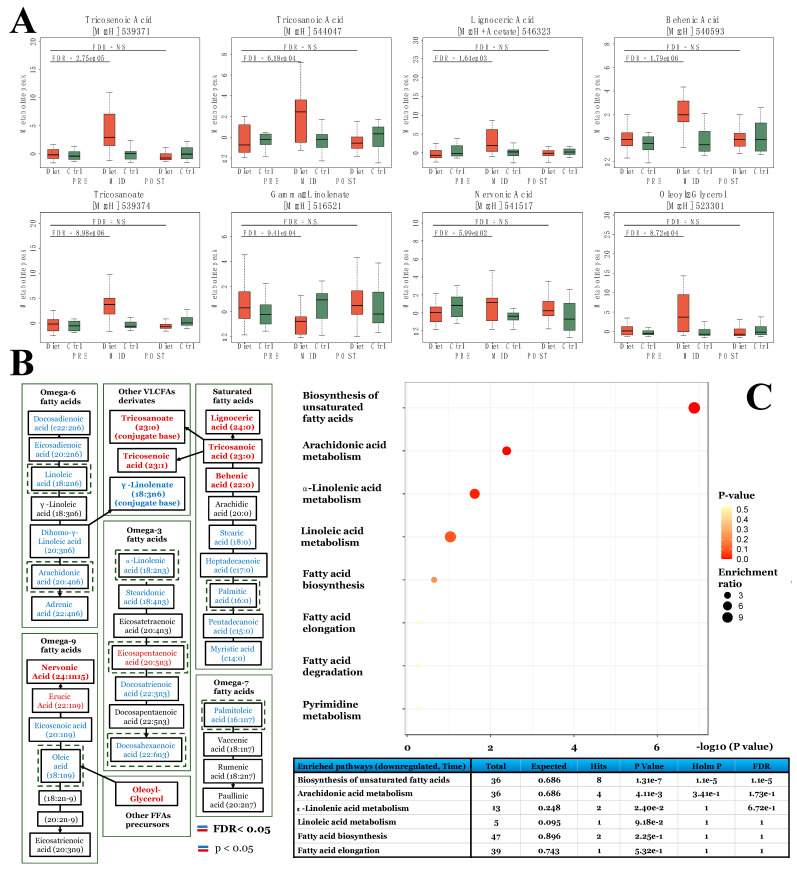
Figure 4.
Substantial fat mass loss to low levels promotes accumulation of very-long-chain free fatty acids (VLCFA). Here, we demonstrate how the prolonged period of low-energy availability and high volume of exercise training leading to substantial fat mass loss (PRE-MID in diet group) modulated plasma fatty acid profile. First, FFAs and their metabolites, namely VLCFAs, that were significant in the diet group when compared to controls (Time × Group, FDR < 0.05) are depicted in panel (A). Following, fatty acid metabolism pathways related to ω-3, -6, -7, -9, and saturated fatty acids and associated reactions are depicted in panel B. Within unsaturated and saturated fatty acid metabolism pathways panel (B), upregulated (FDR < 0.05, red) metabolites are indicated with red color, downregulated (FDR < 0.05, blue) metabolites with blue color, and metabolites with no clear change in metabolite level with black color (PRE-MID). Bold text indicates significance in the interaction (Time × Group) model (Table S2), while normal text significance only in the within-diet group (~Time)-model (Table S3). Lastly, in panel (C), results of the enrichment analysis are shown, where, as input, we used all significantly (FDR < 0.05) downregulated metabolite features in the within-diet group analysis after the weight loss period (PRE-MID) (Table S3). Similar to enrichment analysis of the Time × Group findings, only a limited number of these significantly altered unique metabolite features (28 out of 46) were recognized by the MetaboAnalyst platform.

