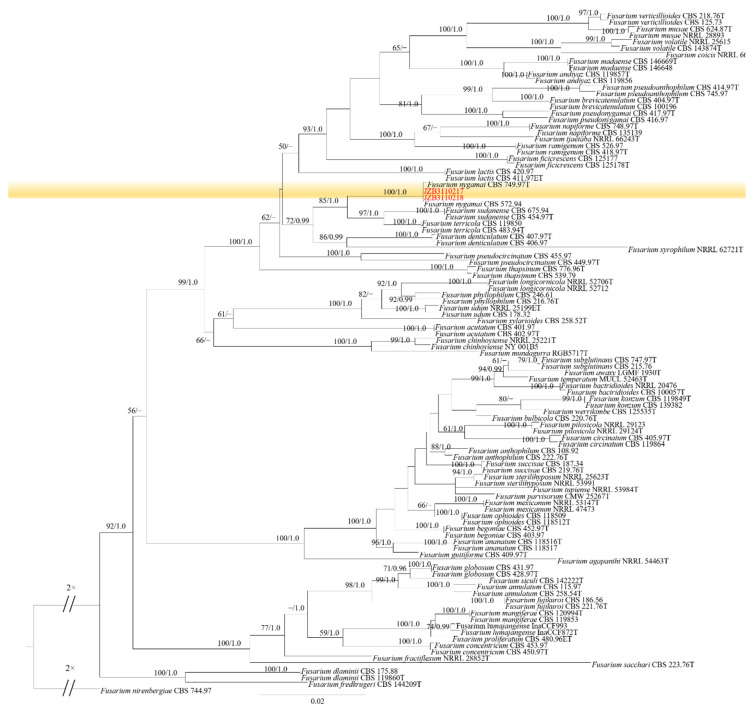
Figure 4.
Phylogenetic tree generated by maximum likelihood analysis (RAxML) of FFSC based on the combined tef1, rpb2, tub2 and CaM sequence data. The tree is rooted with Fusarium nirenbergiae (CBS 744.97). The best-scoring RAxML tree with a final likelihood value of –16,169.804811 is presented. The matrix had 1172 distinct alignment patterns, with 12.61% of undetermined characters or gaps. Estimated base frequencies were as follows: A = 0.246851, C = 0.265429, G = 0.243377, T = 0.244344; substitution rates AC = 1.195289, AG = 4.703565, AT = 1.258970, CG = 0.717390, CT = 9.004544, GT = 1.000000; gamma distribution shape parameter α = 0.838651. ML bootstrap support values ≥50% and Bayesian posterior probabilities (BYPP) ≥ 0.95 are given near the nodes. The scale bar indicates 0.03 changes per site. Isolates belonging to this study are given in red.

