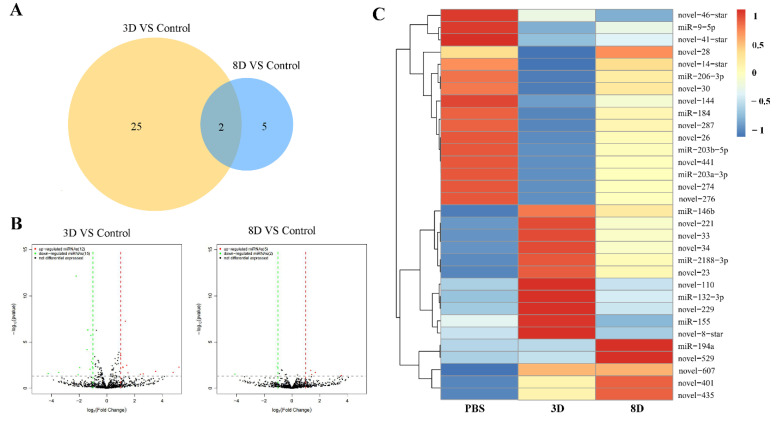
Figure 1.
Analysis of differentially expressed miRNAs (DEmiRs) in C. altivelis following NVV challenge. (A) Venn diagram shows DEmiRs numbers in the two infected groups compared to the control group. The DEmiRs number between the 3D and control groups was orange, while it was light blue between the 8D and control groups. (B) The volcano map shows the overall distribution of DEmiRs. Red color represents significantly differentially up-regulated, while the green color represents significantly differentially down-regulated. Black dots represent non-significantly differential expression. (C) The expression patterns for the 32 DEmiRs. The expression levels of these 32 miRNAs are shown in different colors. The red color indicates the highly expressed DEmiRs, and the blue color for the lowly expressed DEmiRs.

