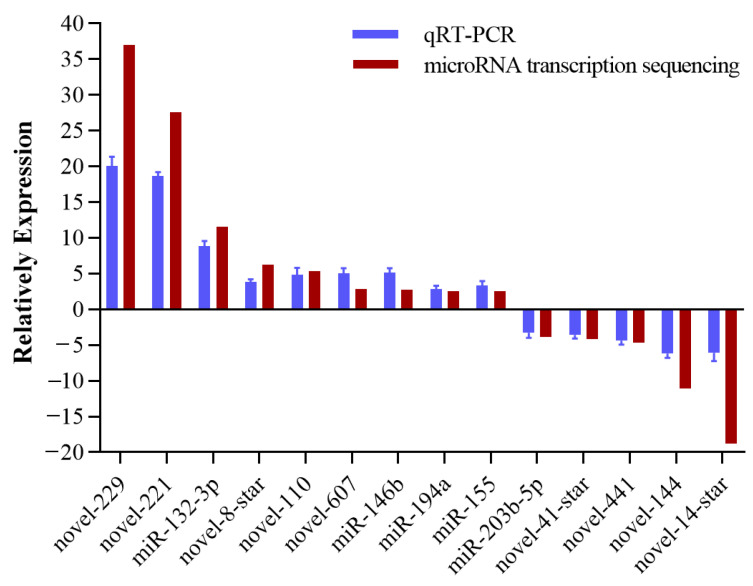
Figure 3.
Validation of miRNA sequence data by qRT-PCR. Fourteen miRNAs were selected to validate the miRNA-seq data using qRT-PCR. Relative expression levels of change between the infected and control groups were calculated and normalized by the U6 housekeeping. Data in this assay were expressed as mean ± SEM (n = 3).

