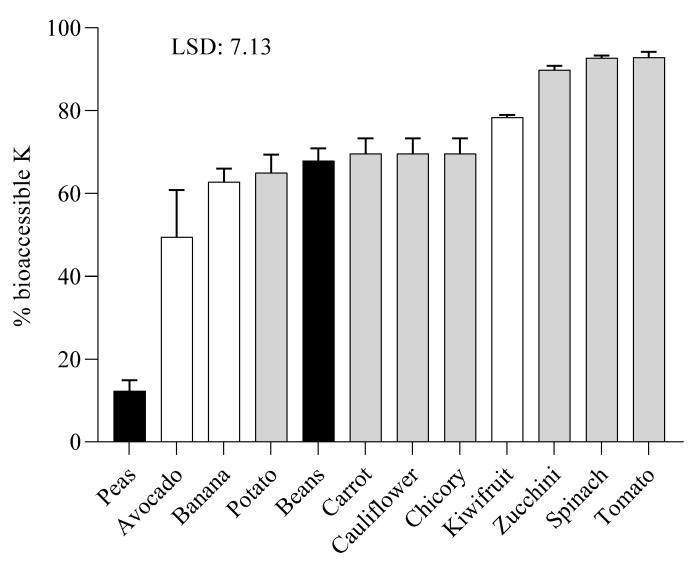
Figure 3.
Percentage (%) of bioaccessible potassium in digested raw samples of fruits (white columns), vegetables (grey columns) and legumes (black columns). Means were statistically analyzed following one-way ANOVA using the species as the variability factors and separated by Fisher’s least significant difference (LSD) post hoc test (p < 0.05).

