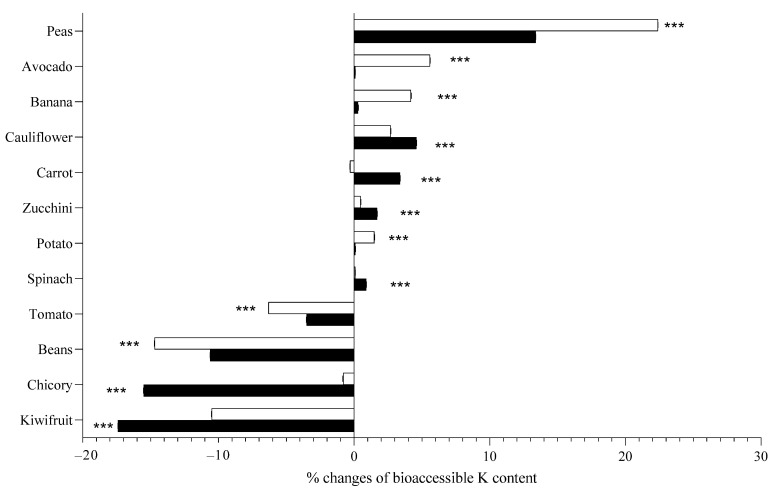
Figure 4.
Percentage variation of bioaccessible potassium in samples analyzed when boiled starting from cold water (full columns) and when boiled starting from hot water (empty columns), when compared with potassium content in raw samples. Considering each sample singularly, means were statistically analyzed by Student’s t test, comparing different boiling procedures. *** p < 0.001.

