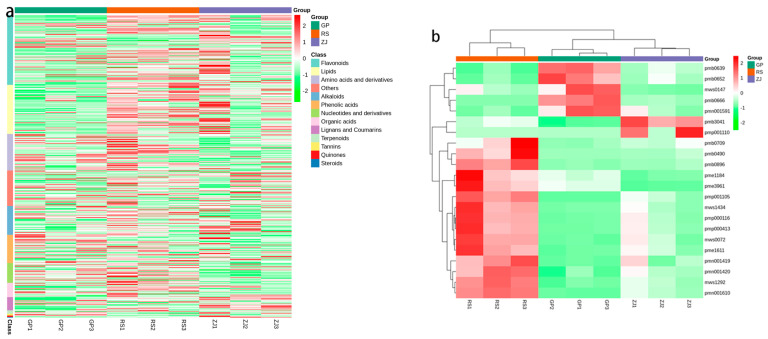
Figure 7.
Heatmaps of hierarchical cluster analysis (HCA): (a) GP vs. RS vs. ZJ; (b) The 22 different metabolites commonly found in RS, GP and ZJ samples. The abscissa is used to display the names of samples, and the ordinate on the right is used to display the classes or names of metabolites. The deeper the red color, the higher the content of the metabolites; the deeper the green color, the lower the content of the metabolites.

