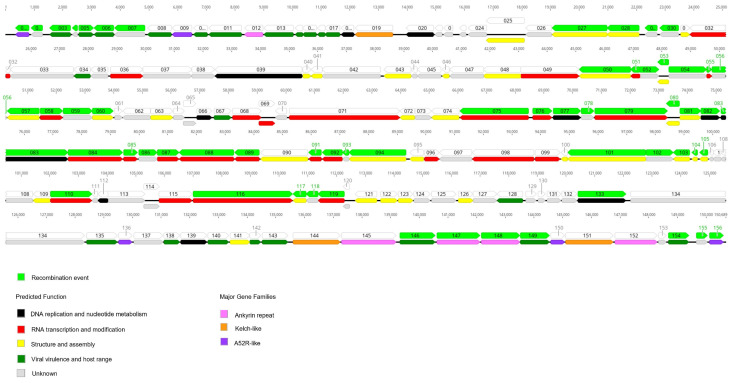
Figure 7.
Gene mapping of LSDV/Thailand/Yasothon/2021. The arrows indicate transcriptional directions. The numbers represent the nucleotide positions from 1 to 150,689 bp. Each ORF is colored based on its recombination event (upper), predicted protein function, and major gene families (lower) [3]. The graphic was created using Geneious Prime® version 2021.2.2. Light green = recombination events; Black = DNA replication and nucleotide metabolism; Red = RNA transcription and modification; Yellow = structure and assembly; Dark green = viral virulence and host range; Grey = unknown; Pink = Ankyrin repeat; Orange = Kelch-like; Purple = A52R-like.

