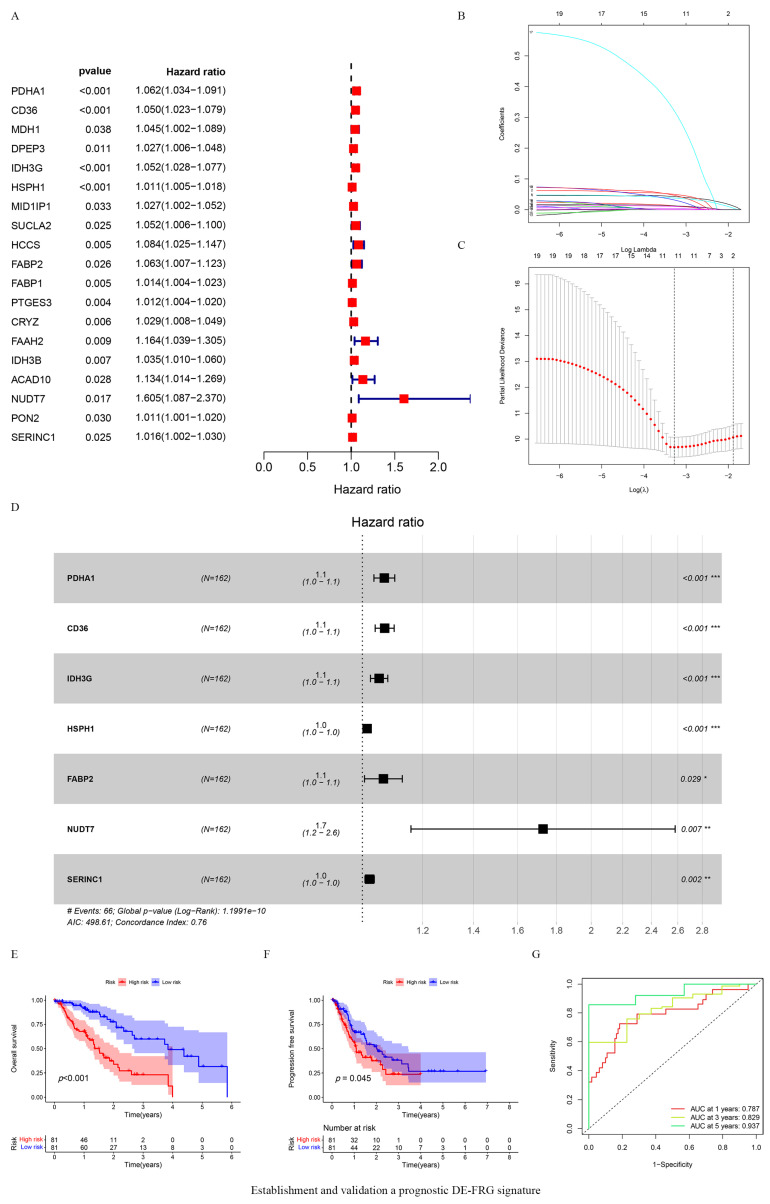
Figure 2.
Establishment and validation a prognostic DE-FRG signature. (A) 19 genes were associated with the clinical outcomes of ESCA patients based on univariate Cox regression analysis; Red squares represnt Hazard Ratio (HR) value. (B) LASSO coefficient profiles of the 19 selected fatty acid metabolic genes; (C) The best parameter (lambda) in the LASSO-Cox model; the red dots indicates the partial probability of deviation values, the gray lines indicates standard error (SE). (D) 7 genes were eventually identified as prognosis related biomarkers based on multivariate Cox regression analysis; ESCA patients were divided into high-risk (n = 80) and low-risk (n = 80) groups based on the median risk score. * p < 0.05, ** p < 0.01, *** p < 0.001. Black squares represent Hazard Ratio (HR) value. (E,F) Kaplan–Meier survival analysis was performed to assess the difference in OS and PFS between the high-risk and low-risk group; (G) ROC curves of risk model for predicting overall survival at 1, 3, and 5 years.

