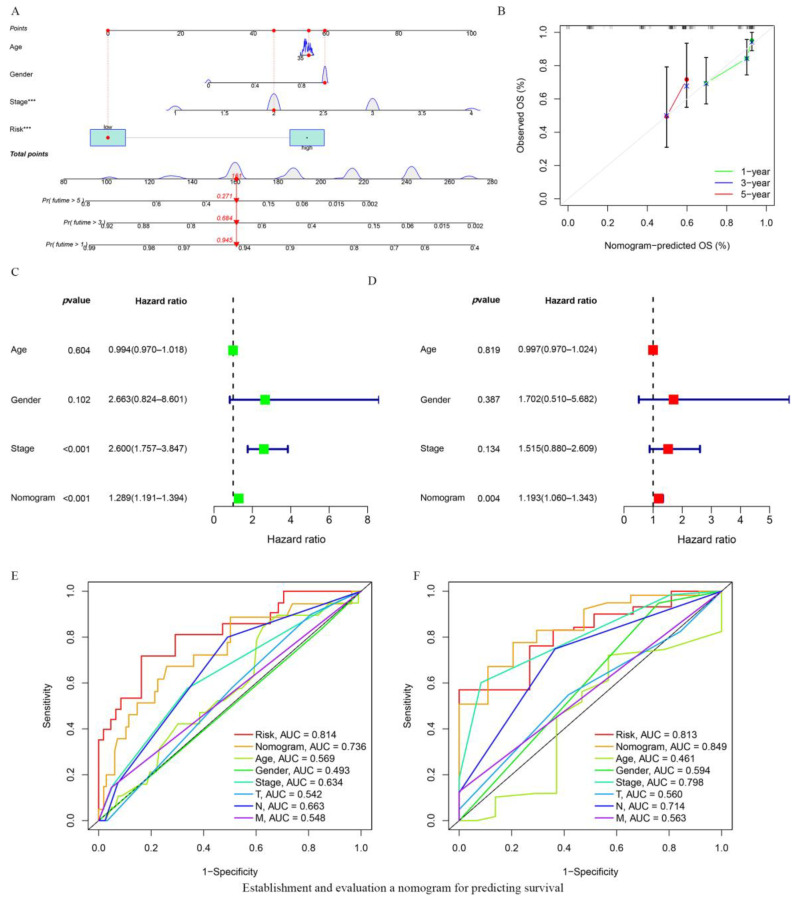
Figure 4.
Establishment and evaluation a nomogram for predicting survival. (A) Nomogram predicting OS of ESCA patients. (B) The calibration plots of the nomogram. The x axis is nomogram-predicted survival, and the y axis is actual survival. (C) Univariate Cox regression analysis of the nomogram. (D) Multivariate Cox regression analysis of the nomogram. Red and green square represent HR value. (E,F) ROC curves at 1 and 3 years showing the predictive ability of the nomogram.

