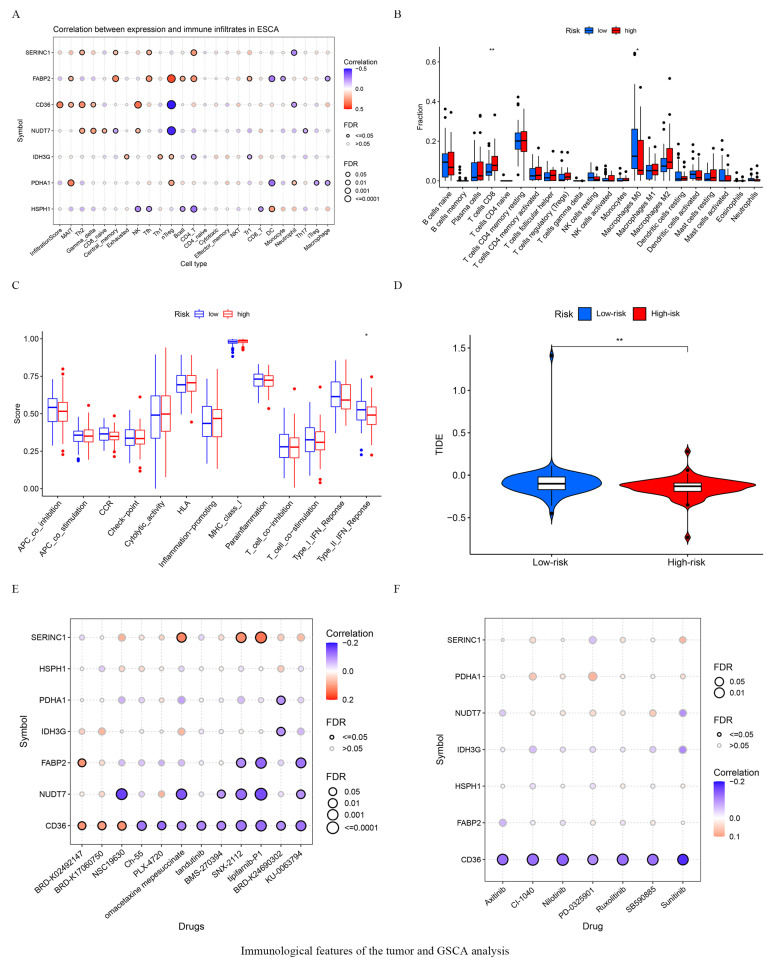
Figure 5.
Immunological features of the tumor and GSCA analysis. (A) The correlation between 7 key genes and infiltrated immune cells. Different color circle denote different p value, the smaller the p value, the larger the circle. (B) The ratios of 22 immune cell types in high- and low-risk patients. The black circle represents a single individual. (C) Immune function difference in high- and low-risk group in ESCA patients. (D) Comparison of Immunotherpy response between high- and low-risk patients. (E) Correlation between CTRP drug sensitivity and 7 key gene expressions. (F) Correlation between GDSC drug sensitivity and 7 key gene expressions. * p < 0.05, ** p < 0.01.

