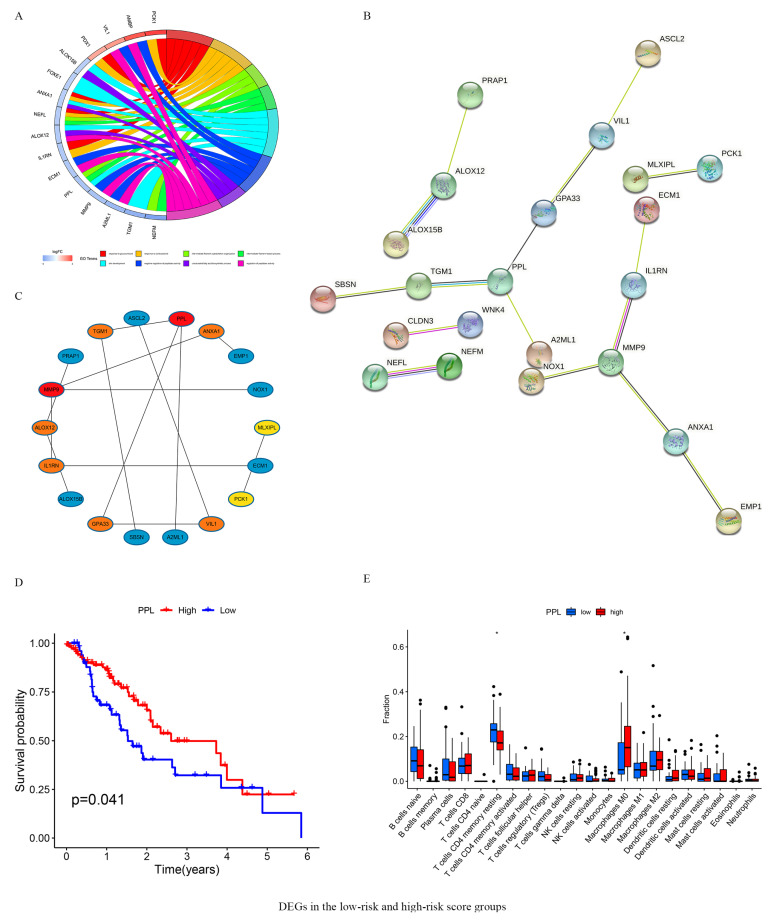
Figure 6.
DEGs in the low- and high- risk score groups. (A) The results of GO enrichment analysis on DEGs. (B) PPI network processed by STRING. (C) Identification of 10 hub DEGs using cytoHubba software. (D) Survival analysis for subgroup patients stratified by PPL mRNA expression. (E) The abundance of each infiltrated cell in patients with high- and low PPL mRNA expression. DEGs in 160 ESCA patients between 2 different risk groups were analyzed using the Limma R package (|logFC| > 1, FDR < 0.05). Black circle represent individual values. * p < 0.05.

