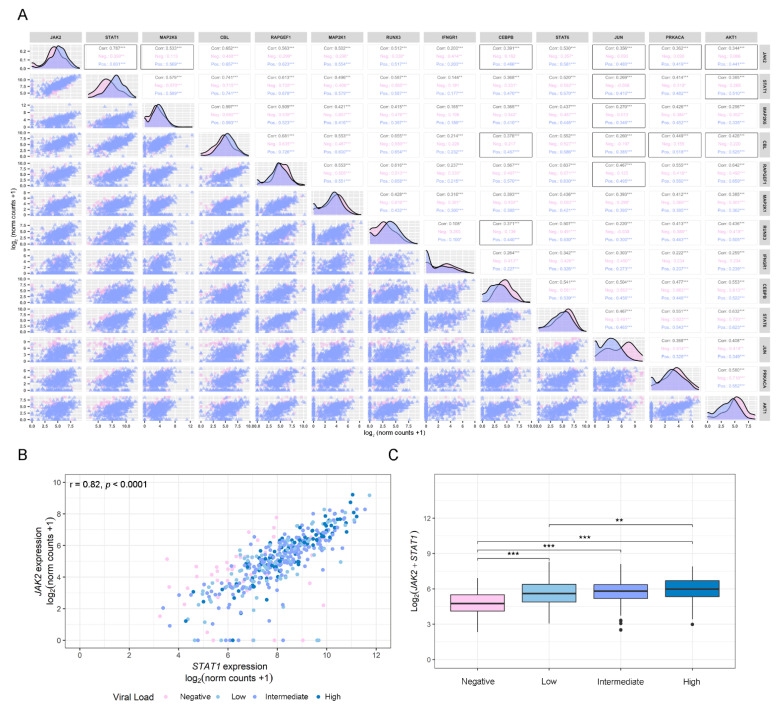
Figure 3.
Correlation analysis. (A) Pairwise Spearman correlation matrix analysis between all genes of interest using the GSE152075 dataset. The upper half displays the Spearman coefficients (r) considering all patients (Corr.; black), non-COVID-19 patients (Neg.; pink), or COVID-19 patients (Pos.; purple). Black boxes highlight pairs of genes that have significant correlation only in COVID-19-positive patients, except for JAK2/STAT1, which was the pair with the highest coefficient in COVID-19-positive patients. The lower half displays the scatterplots. (B) Dot plot representing pairwise Spearman correlation for JAK2 and STAT1, considering viral load in COVID-19-positive patients from the GSE152075 dataset. Viral load is represented as a color scale and was categorized as Negative (pink), Low (first quartile; light blue), Intermediate (second and third quartile; purple), or High (fourth quartile; blue), and was considered as an independent variable expressed as cycle threshold (Ct) by RT-qPCR for the N1 viral gene at time of diagnosis. The interpretation for viral load is the lower the Ct, the higher the viral load. (C) Box plot representing the combined expression of JAK2 + STAT1 and their association with the viral load. Viral load was categorized as Negative (pink), Low (first quartile; light blue), Intermediate (second and third quartile; purple), or High (fourth quartile; blue). p-values correspond to Wilcoxon rank-sum test. Statistical significance * p < 0.05; ** p < 0.01; *** p < 0.001.

