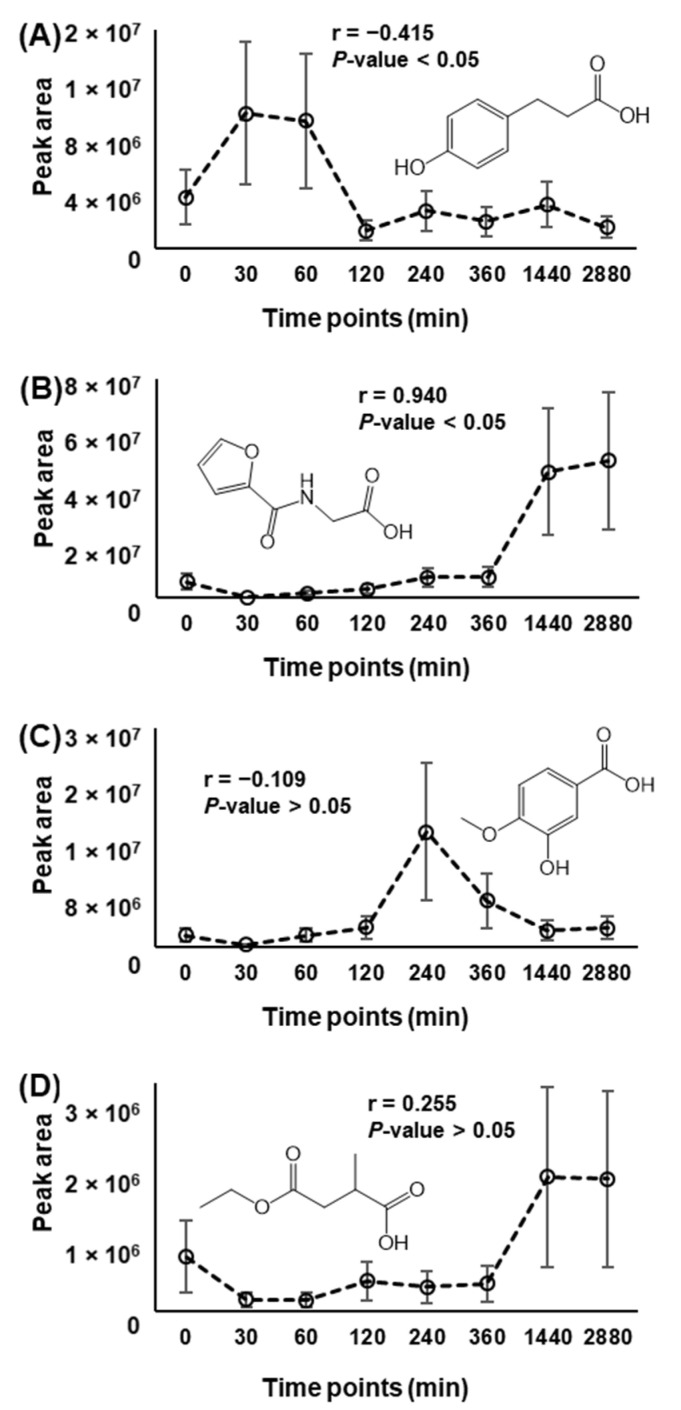
Figure 2.
Representative examples of the use of PPMC coefficients (r) to evaluate phase I and II metabolisms of annotated metabolites (Table S2), as described in Section 2.7 of the main text. (A) Significant and negative r-value indicating a phase II metabolism. (B) Significant and positive r-value indicating a phase I metabolism. (C) Non-significant and negative r-value. (D) Non-significant and positive r-value.

