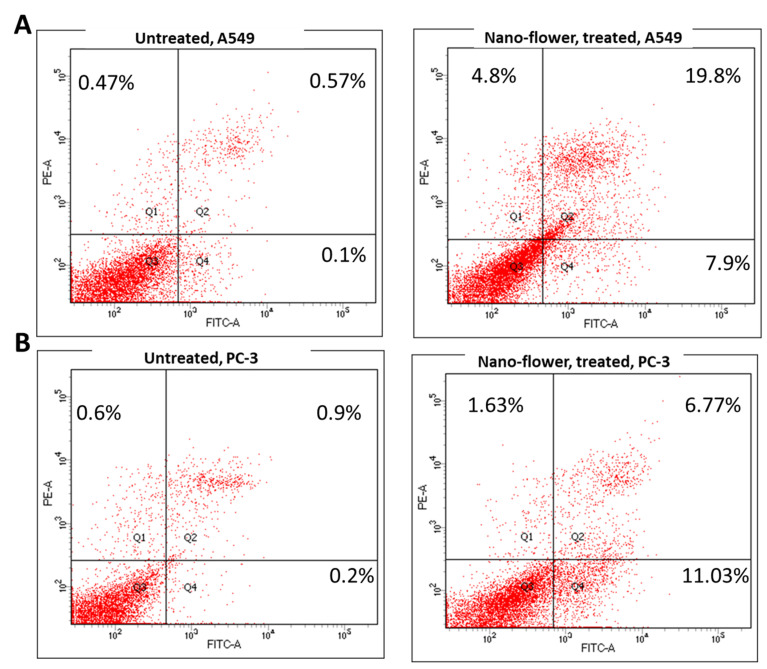
Figure 4.
Cytograms for apoptosis–necrosis assessment using flow cytometry. (A) Annexin V/PI staining of untreated and treated A549 cancer cells with flower extract AgNPs (IC50 = 1.52 µM, 48 h). (B) Annexin V/PI staining of untreated and treated A549 cancer cells with flower extract AgNPs (IC50 = 2.47 µM, 48 h). Q1: necrosis, Q2: late apoptosis, Q4: early apoptosis (lower panel).

