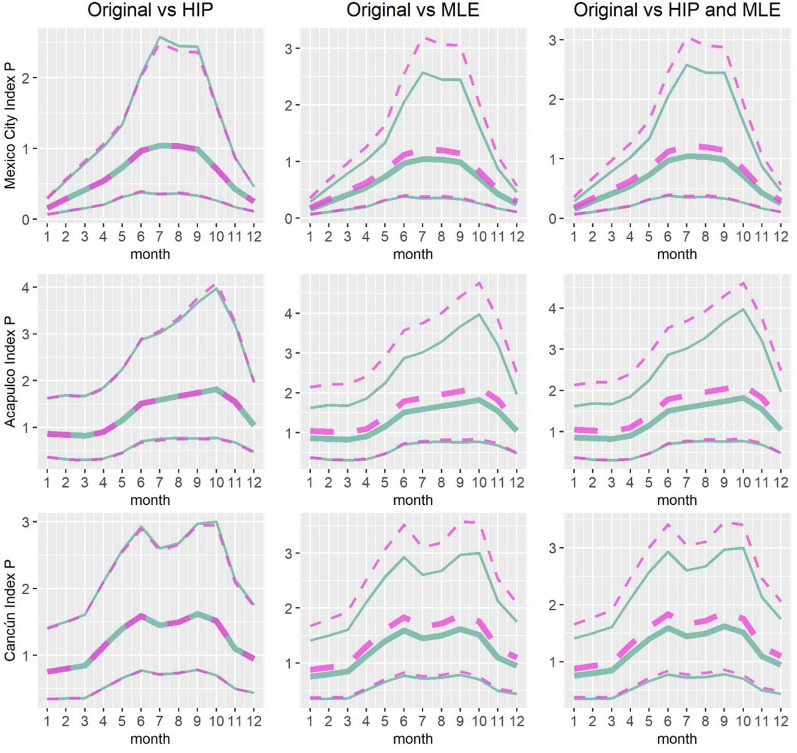
Fig. 13.
The blue solid line shows the average monthly index P and its 95% confidence interval (upper and lower thresholds) during 2010–2020 when using the same priors as Obolski et al. [18]. The pink dashed line shows these estimates changing two parameters to the values used by Petrone et al. [15]. The left-hand side panel shows the estimation when changing the Human Incubation Period (HIP) parameter. The middle panel shows the estimations when changing the Mosquito Life Expectancy (MLE) parameter. The right-hand side parameter shows the estimation when changing both these parameters simultaneously

